Reserve Baseline · desk study · v0.1
Omo Forest Reserve: what the satellites say before anyone goes there
Omo is still mostly under trees, but little of it is intact forest. Of 131,907 ha, 16.6% is moist forest with no recorded disturbance, 46.3% is degraded forest, and about 9% has been cleared since 1990. The carbon the public maps show is far lower than field studies of Nigerian rainforest report, and that gap decides whether Omo can pay for itself.
This is a desk study. Nobody from Kam Edge has been to the reserve for it. It uses only free satellite products and a public boundary file, and took no approvals. Section 7 says what a field pilot would add.
Claims are tagged. Measured is read directly from a public dataset. Derived is arithmetic on those readings. Assumption is our judgement.
1The reserve
- Boundary used. World Database on Protected Areas polygon, site 36820, designation Forest Reserve. No gazette was consulted. Measured
- Area. 131,907 ha by this polygon, against 130,600 ha in published sources. The two agree within 1%.
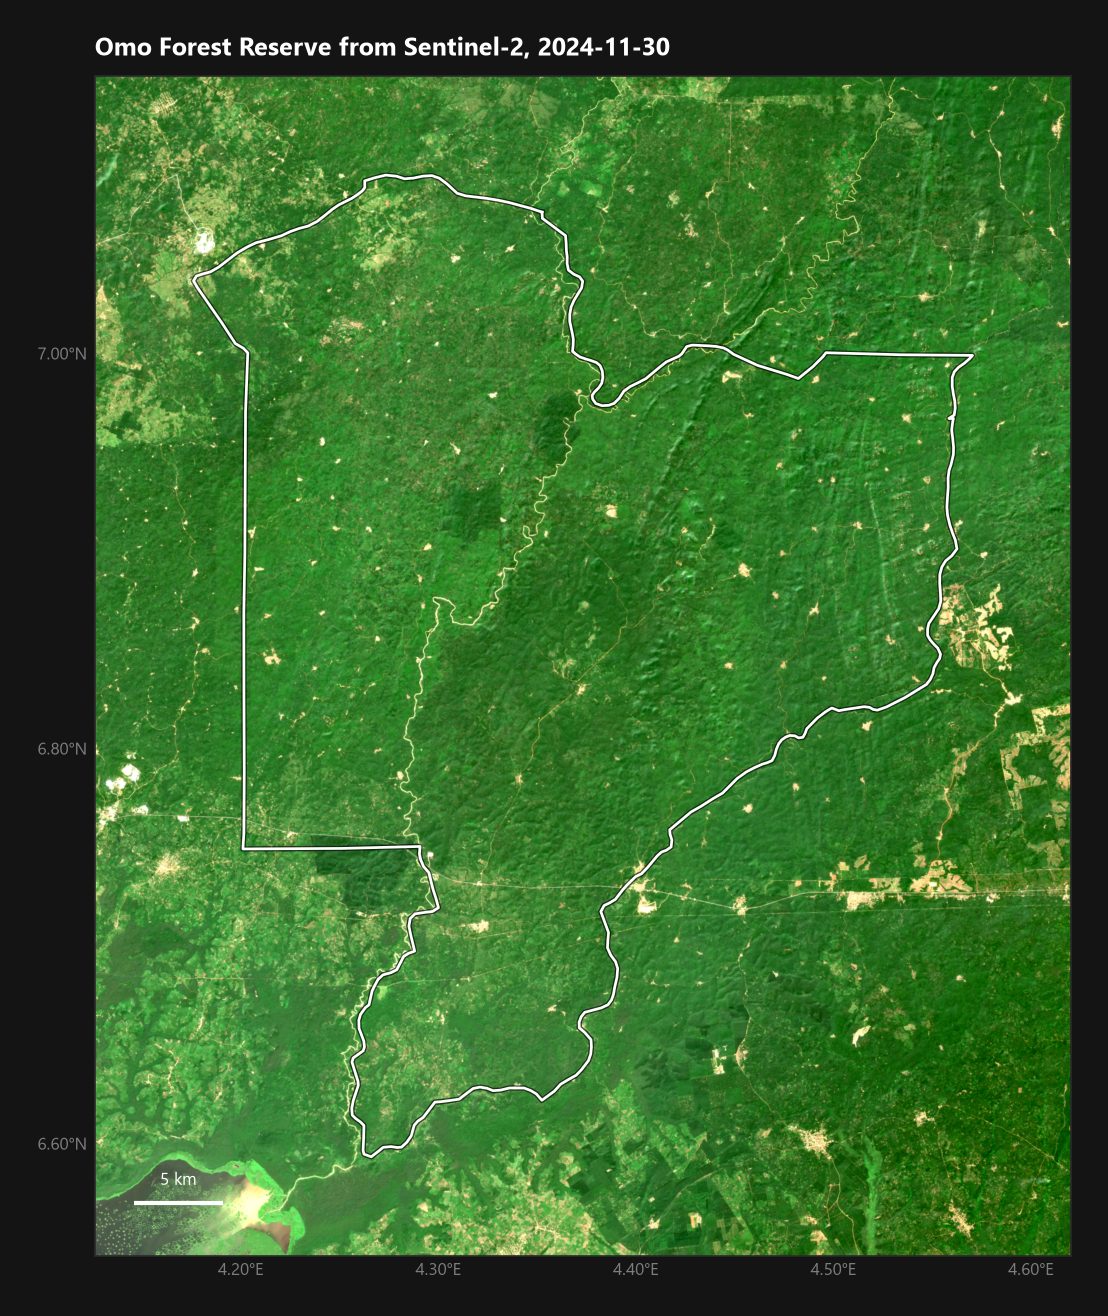
- Location. Ogun State, centred near 6.8747°N 4.3515°E.
- Not established here. The gazette reference, enclave boundaries, the settlements inside, existing concessions, and the proposed 55,000 ha wildlife sanctuary. These need state forestry records.
2Forest history
Two independent records were used. They measure different things and should be read together.
2.1 The JRC record: what kind of forest is left
| Class | Hectares | Share of reserve |
|---|---|---|
| Undisturbed moist forest | 21,881 | 16.6 |
| Degraded moist forest | 61,025 | 46.3 |
| Forest regrowth | 14,766 | 11.2 |
| Deforested, other land | 10,680 | 8.1 |
| Disturbance under way (2023-2025) | 1,503 | 1.1 |
| Other land cover | 22,028 | 16.7 |
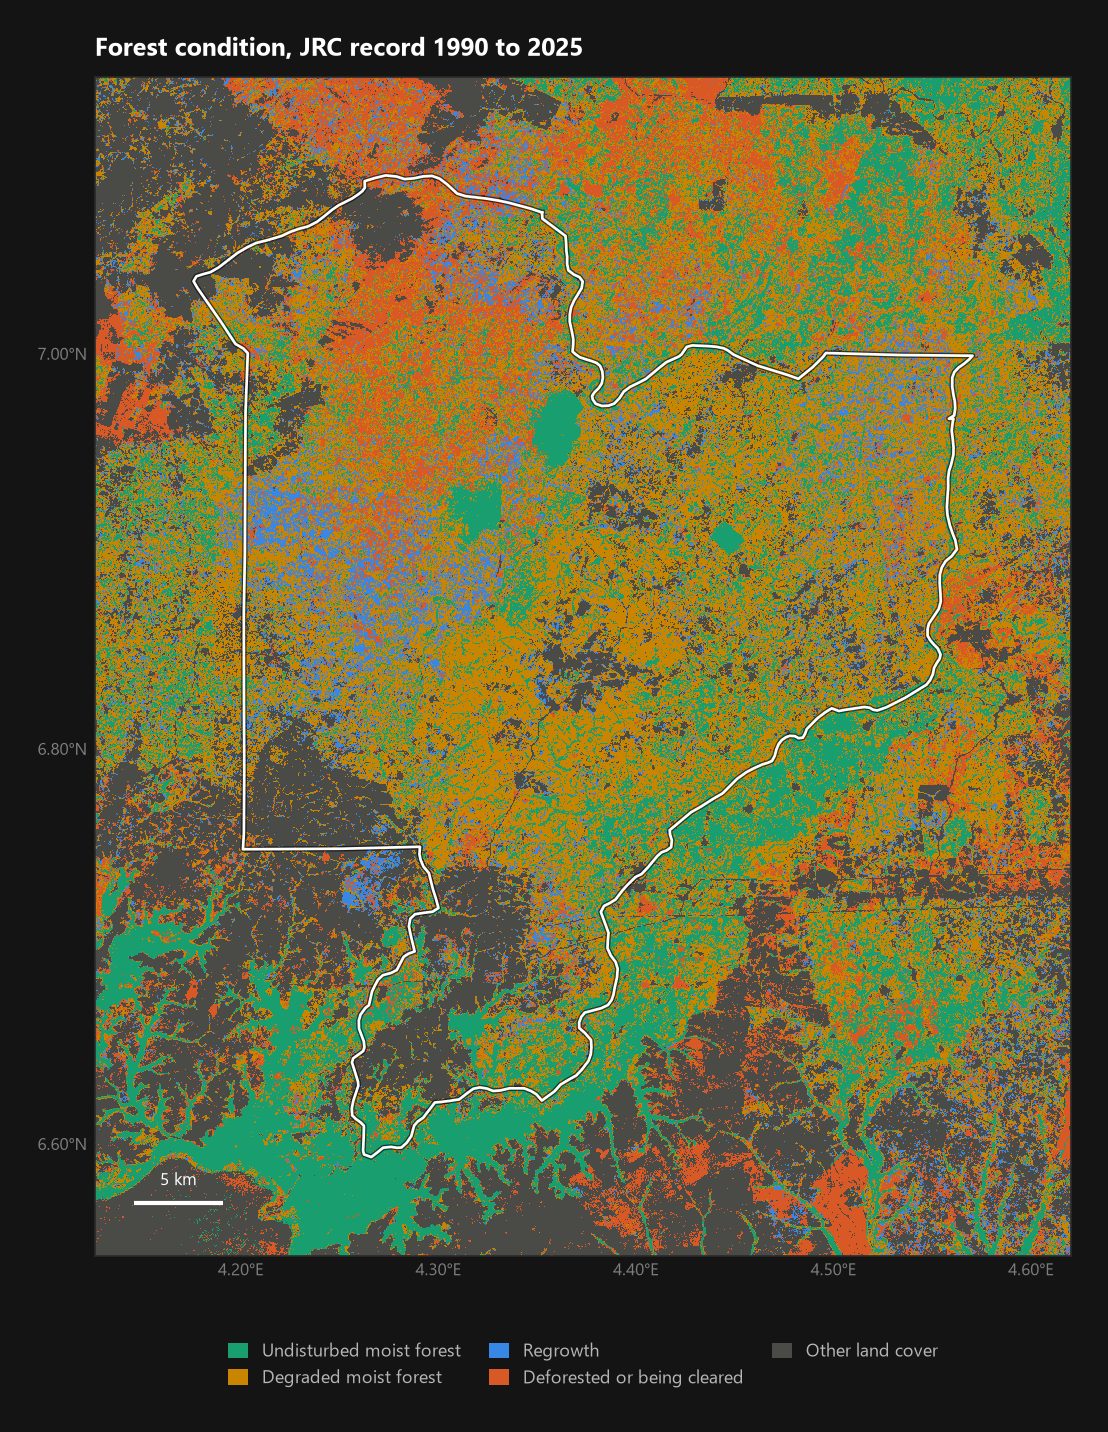
- 74.0% of the reserve is standing moist forest of some kind (undisturbed, degraded or regrown). Derived
- 16.7% was never recorded as moist forest. This is land that was already farm, plantation or settlement when the record begins.
- The land around the reserve holds more undisturbed forest than the reserve does: 27.8% of the 5.5 km ring against 16.6% inside. Most of it is swamp forest along the southern edge. Measured
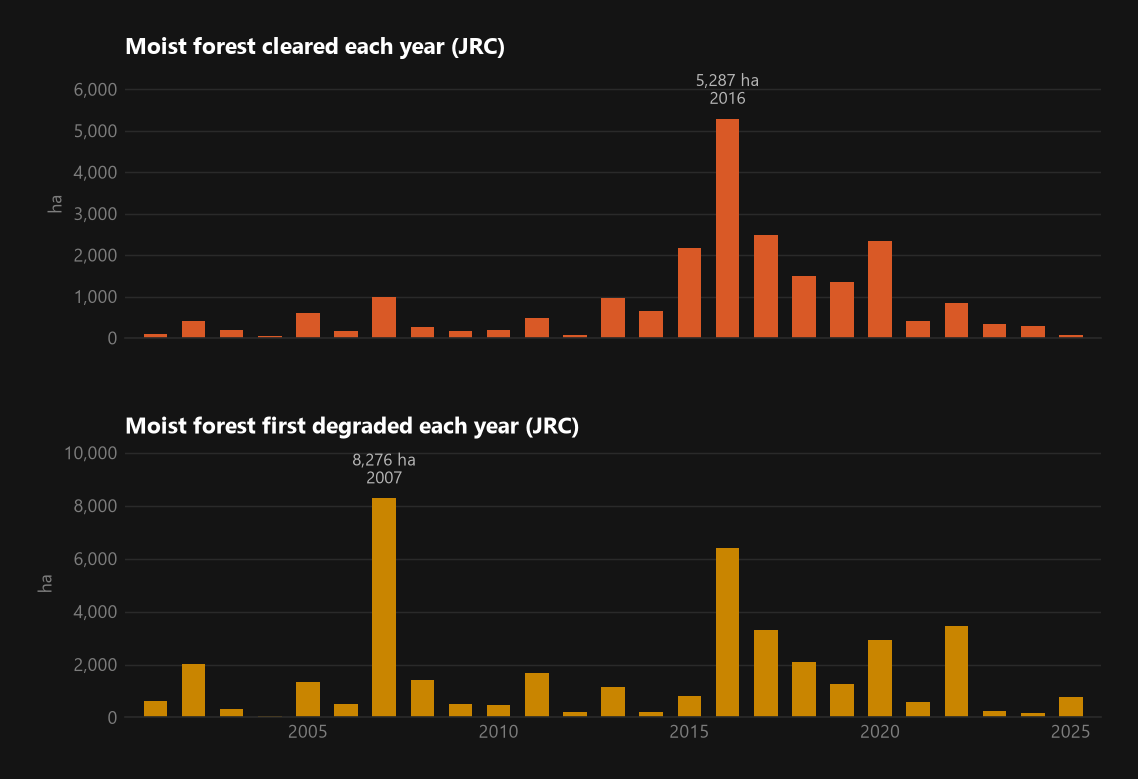
- Clearing peaked in 2016 at 5,287 ha. The ten-year average is 1,494 ha a year; the last five years average 396 ha.
2.2 The Hansen record: where tree cover was removed
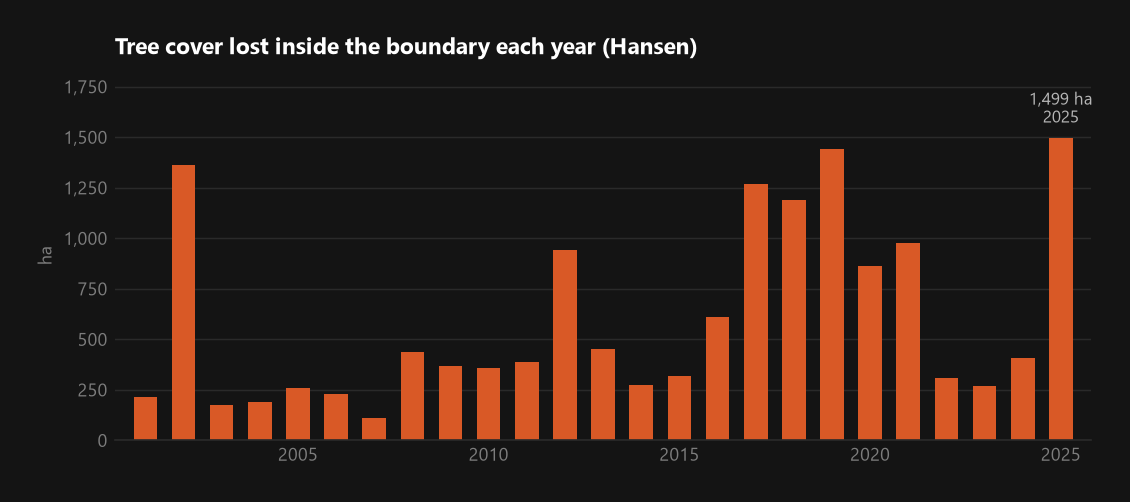
- 14,920 ha of tree cover was lost inside the boundary from 2001 to 2025, 11.3% of the reserve. Measured
- The recent rate is 693 ha a year (0.53% of the reserve), averaged over 2021 to 2025.
- 2025 was the largest year in the record at 1,499 ha. The latest year in this dataset is often revised, so treat it as provisional.
- Outside is worse. The surrounding ring lost 1.13% a year over the same period, about twice the rate inside. The boundary is doing something.
- This is not the same as deforestation. The dataset records any removal of tree canopy, including plantation harvest and tree crops being replaced.
3Present condition
- A land-cover map calls 97.7% of Omo "tree cover". Set beside the JRC record, that figure shows how little a tree-cover map says about forest: cocoa under shade, old plantations and logged forest all count. Measured
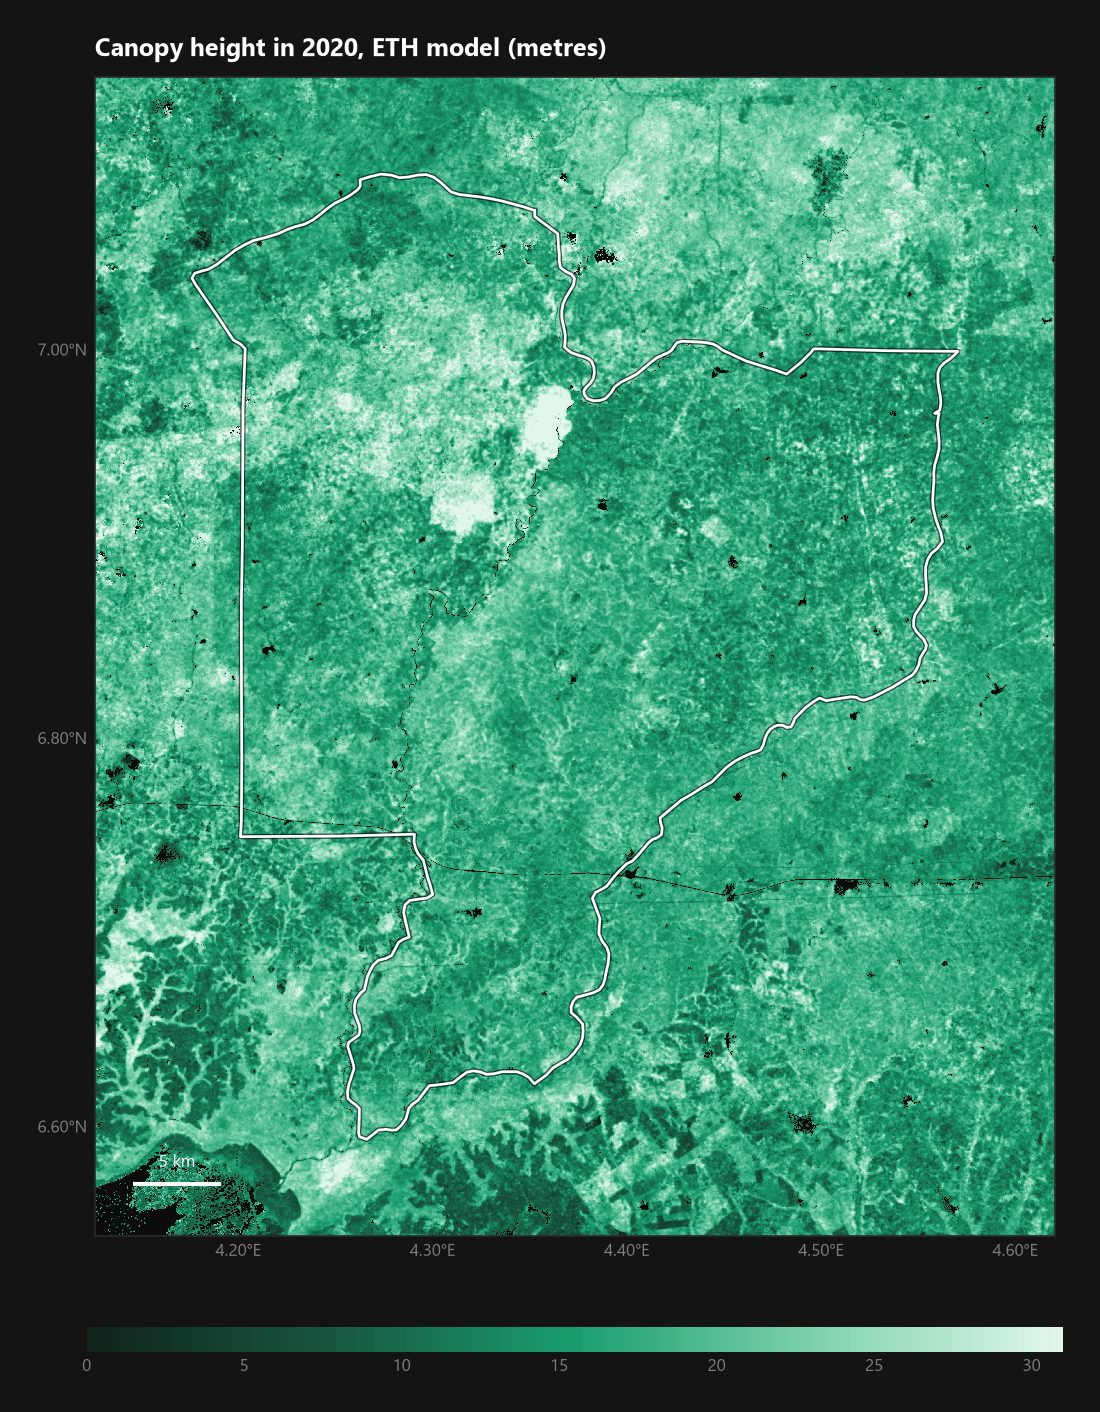
- The canopy is mid-height. Modelled mean height is 18.0 m. Only 7.3% of the reserve is 25 m or taller, the height of mature lowland rainforest.
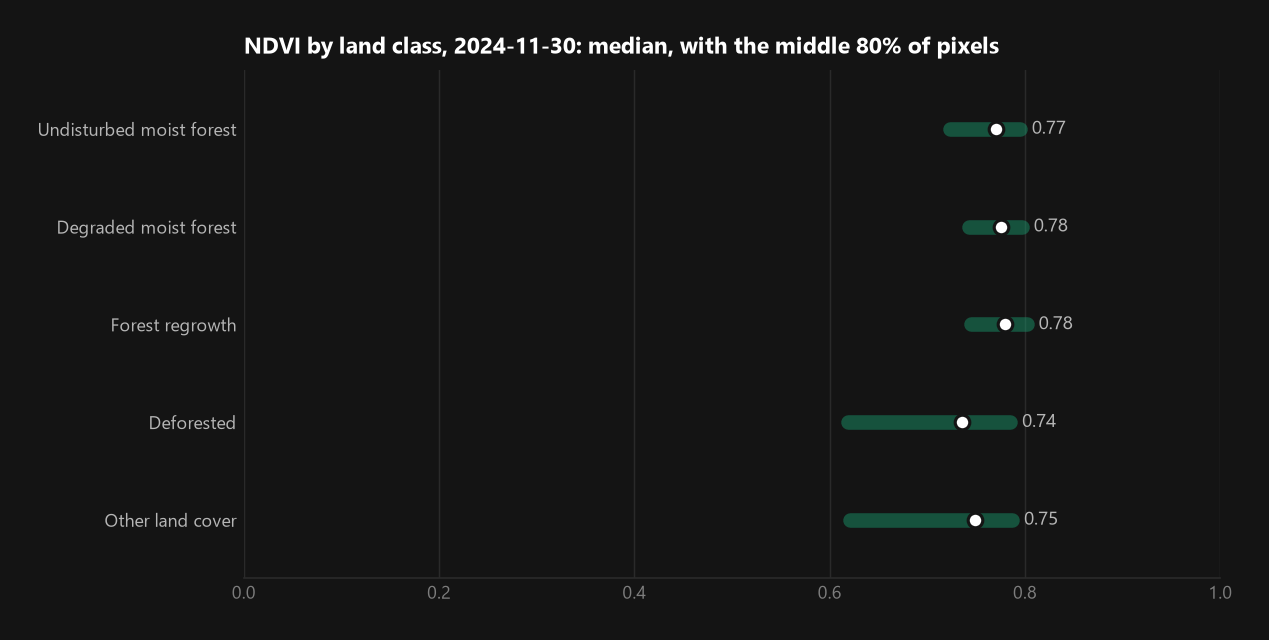
- NDVI cannot tell intact forest from degraded forest here. Median NDVI is 0.77 for undisturbed forest, 0.78 for degraded and 0.78 for regrowth. Even cleared land reads 0.74. Measured
4First carbon estimate
| Class | Biomass, t per ha | CO2e, t per ha | Map error, t per ha |
|---|---|---|---|
| Undisturbed moist forest | 100.1 | 173 | 61.9 |
| Degraded moist forest | 93.0 | 160 | 59.9 |
| Forest regrowth | 48.6 | 84 | 29.0 |
| Deforested | 42.7 | 74 | 26.0 |
| Other land cover | 67.9 | 117 | 41.7 |
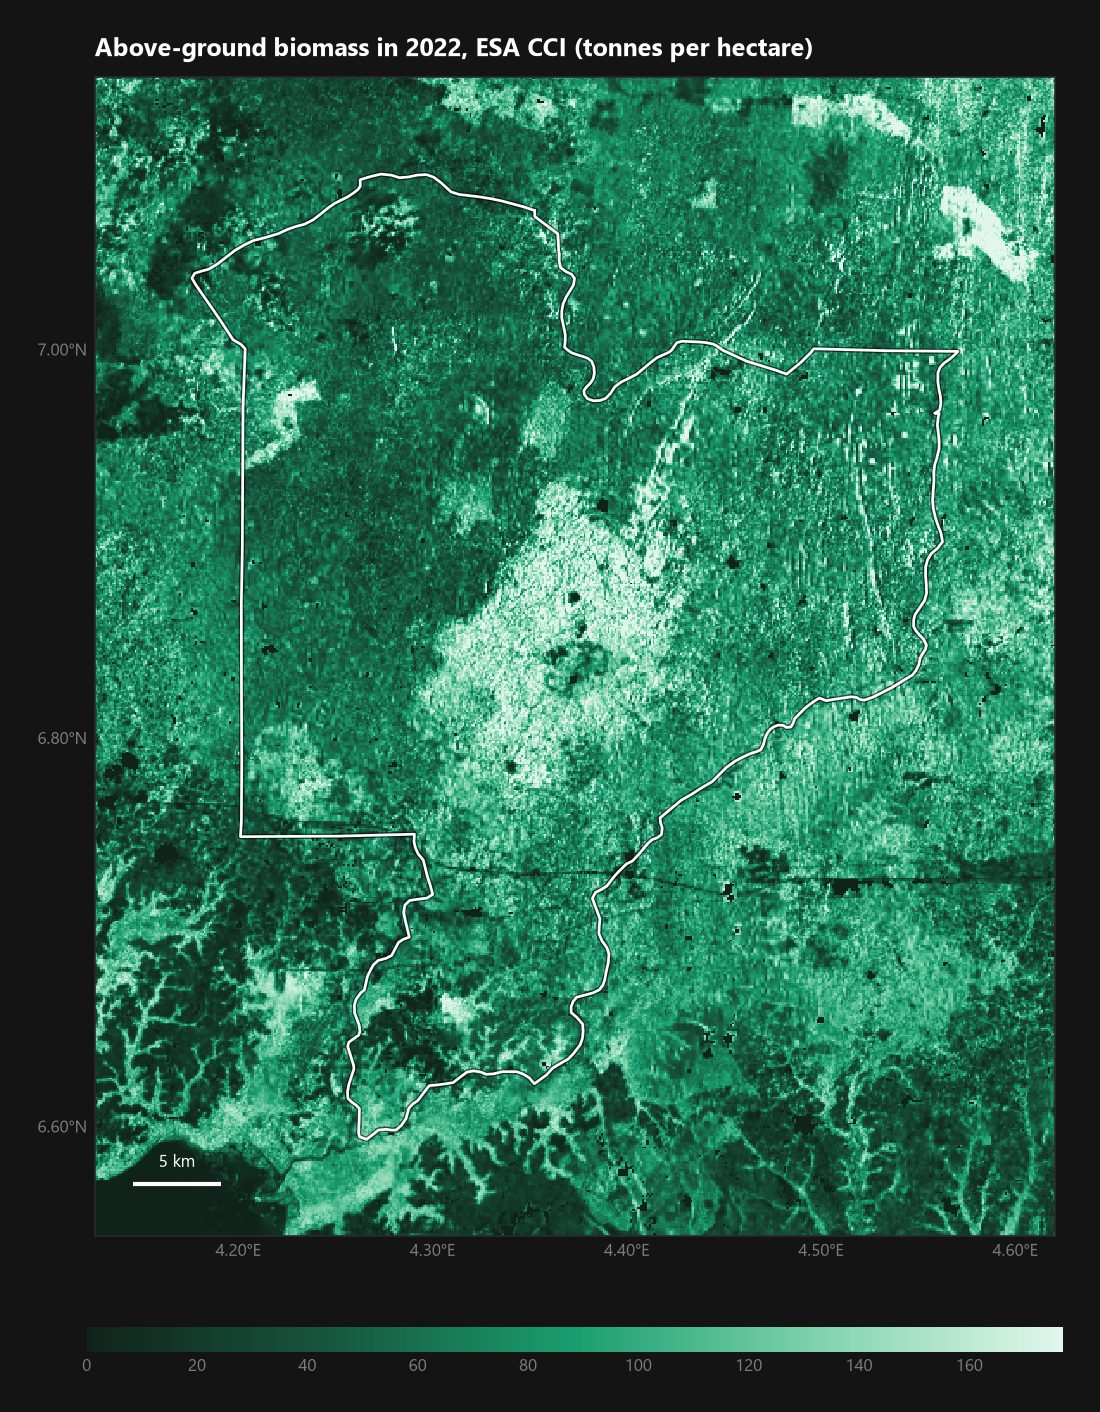
- Whole reserve: 10.29 million tonnes of above-ground biomass, or 17.7 million tonnes of CO2e, averaging 78.1 t of biomass per hectare. Derived
- Uncertainty: the map's own error is about ±63% if pixel errors move together, which is the cautious reading. That is ±11.1 million tonnes.
- Roots, soil and dead wood are not counted.
The map puts undisturbed forest in Omo at 100 t of biomass per hectare, about 47 t of carbon. Published field studies of Okomu and Cross River report about 178 t of carbon per hectare. That is nearly four times as much.
Either this radar map reads low in dense forest, which is a known weakness, or Omo's forest is badly depleted. Both are probably true in part. Satellite data cannot settle it. Fifty to eighty ground plots can.
5Pressure map
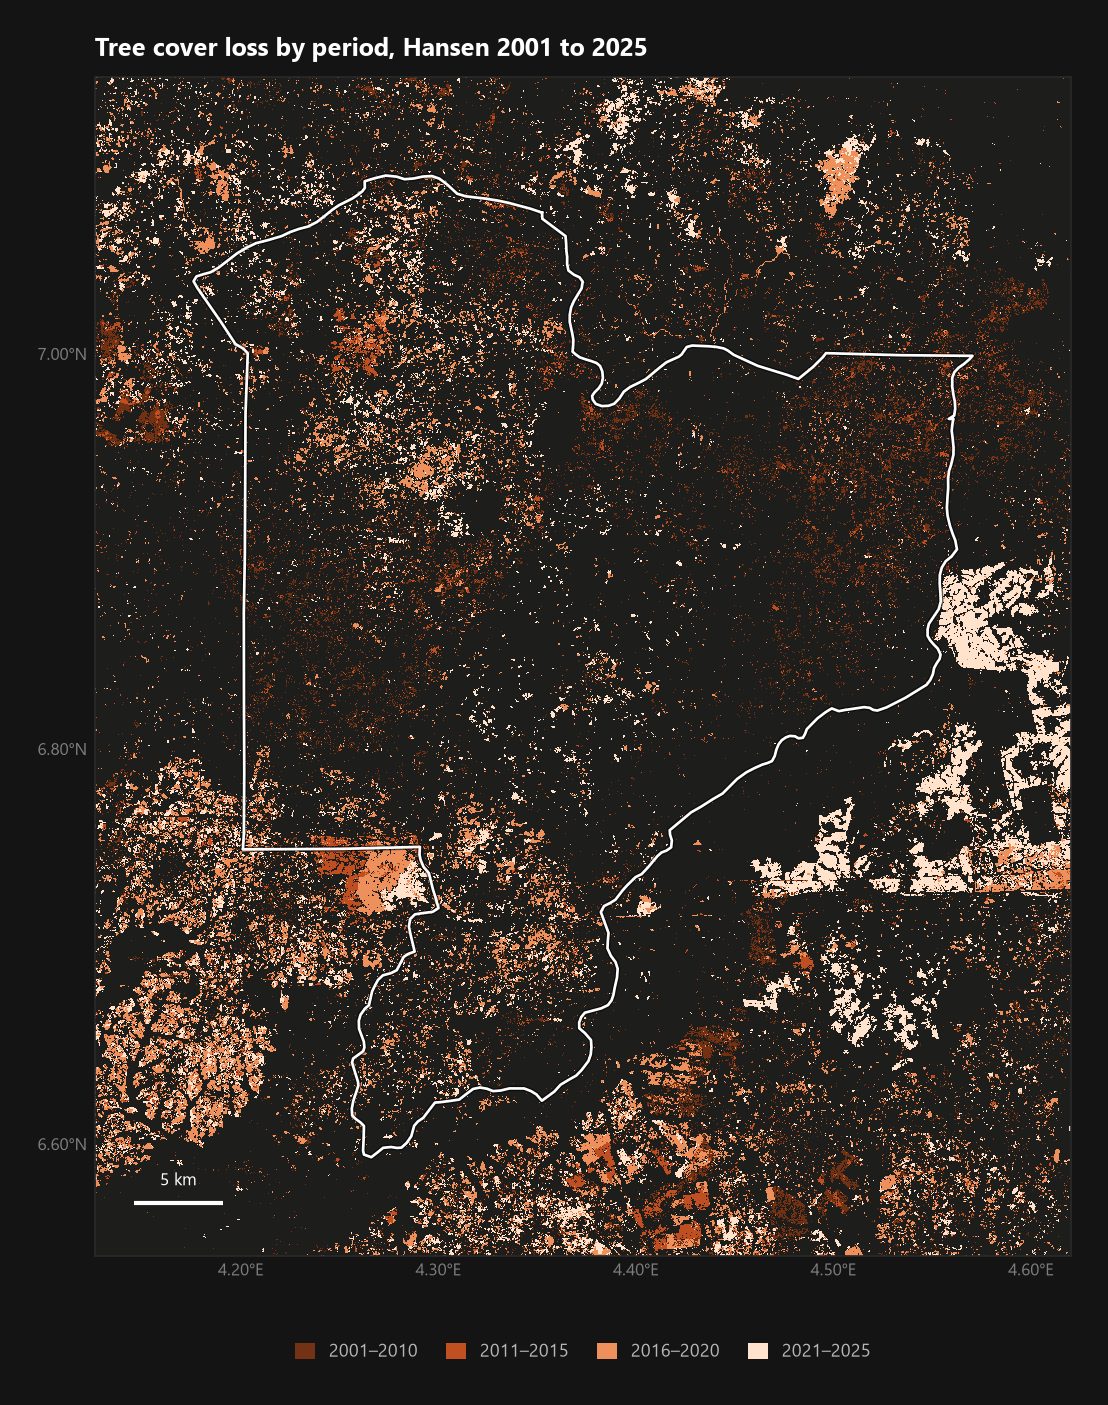
- Loss is not an edge problem. The outer 2 km of the reserve is 27.1% of its area and took 21.8% of the 2021 to 2025 loss. Clearing is spread through the interior. Derived
- That fits farms and settlements inside the boundary, not encroachment from outside. Patrolling the perimeter would miss most of it. Assumption
- The north-west is the oldest and largest front. Recent loss is more scattered, with clusters in the centre and east.
Live disturbance alerts were not included in this version. The free radar alerts need an access key that we have not yet requested.
6Revenue readiness
| Step | Low | High |
|---|---|---|
| Clearing avoided, ha per year (last five years; last ten) | 396 | 1,494 |
| Emission per hectare cleared, t CO2e (forest minus cleared land, map biomass) | 87 | 99 |
| Gross emissions avoided, t CO2e per year | 34,327 | 147,785 |
| Credits after deductions and effectiveness | 10,298 | 72,415 |
| Revenue at $5 to $10 a credit, per year | $51,490 | $724,149 |
| Per hectare of reserve, per year | $0.39 | $5.49 |
Above-ground biomass only. Deductions of 30-40% for buffer, leakage and uncertainty; 50-70% effectiveness; $5-10 per credit. Baseline taken from the reserve's own history, which a carbon standard would not accept as is. Derived
| Stream | Reading for Omo |
|---|---|
| Avoided deforestation | Possible, but small on map biomass. Planning figures for lowland rainforest are often near 500 t CO2e emitted per hectare cleared. The map gives 87 to 99. If plots confirm stocks near the published 653 t CO2e per hectare, the emission factor and the revenue rise several times. |
| Avoided degradation | Probably the larger story. 46.3% of the reserve is degraded forest and degradation is continuing. Crediting it needs repeated field or lidar measurement; maps cannot do it. |
| Restoration | Large on paper. About 12,206 ha has been cleared since 1990 and 14,766 ha is regrowing. Most cleared land is farmed, so restoration depends entirely on agreement with the people farming it. |
| Biodiversity, water, tourism | Not assessable from this data. Omo's elephants and chimpanzees are documented by others. |
7What a field pilot would add
- Ground plots, first. Fifty to eighty plots across undisturbed, degraded and regrowth forest to settle the biomass question in section 4. Nothing else changes the economics as much.
- Lidar strips across the same classes, to carry the plot figures across the reserve and to measure degradation directly.
- The real map of people. Settlements, enclaves and farms inside the boundary, agreed with the state and the communities.
- Acoustic alert nodes in the interior, where the loss is, not on the perimeter.
- The gazette and concession records from the Ogun State forestry department.
- Radar alerts. Only 14 Sentinel-2 scenes in the past year were under 40% cloud. Optical monitoring alone will not work here.
8Sources and limits
| Layer | Source | Resolution and date | Limit |
|---|---|---|---|
| Boundary | World Database on Protected Areas, UNEP-WCMC | Site 36820 | Polygon as published; not checked against a gazette |
| Tree cover loss | Hansen Global Forest Change v1.13 | 30 m, 2001 to 2025 | Loss of tree cover, not of forest; includes plantation harvest and fire |
| Forest condition | JRC Tropical Moist Forest | 30 m, 1990 to 2025 | Moist forest only; recent clearing is confirmed late |
| Land cover | ESA WorldCover v200 | 10 m, 2021 | One year; tree crops count as tree cover |
| Canopy height | ETH Global Canopy Height | 10 m, 2020 | A model trained on space lidar; overestimates open woodland |
| Biomass | ESA CCI Biomass v6 | 100 m, 2022 | Radar-based; known to read low in dense forest |
| Recent image | Sentinel-2 L2A | 20 m, 2024-11-30 | Scene S2A_31NFH_20241130_0_L2A |
- Areas are computed per pixel from latitude. Tree cover loss counts every loss pixel inside the boundary.
- Biomass by class uses only 100 m pixels at least 80% covered by one class. NDVI by class uses 20 m pixels at least 95% covered.
- Carbon is 47% of biomass. CO2e is carbon times 44/12.
- Nothing here has been checked on the ground or against state records.