Kam Origin · cocoa evidence · desk study v0.1
Cocoa in Ondo and Cross River, read the way an EU buyer must read it
From 30 December 2026, an EU importer must show that the cocoa it buys was grown on land that was not forest at the end of 2020, has not been cleared since, and is farmed legally. We ran that test on 20 mapped cocoa farms in Ondo, four cocoa estates and four forest reserves with documented cocoa inside. The deforestation test mostly passes or cannot be decided from space. The legality test is where the risk is: 8 of the 20 farms sit inside a gazetted forest reserve.
Kam Origin is the cocoa side of Kanopy. It uses the same public satellite layers and the same rule: every figure here can be recomputed from the sources listed. Nobody from Kam Edge visited these farms for this page, and no farmer was asked. It is a demonstration of the check, not a verdict on any farm.
Claims are tagged. Measured is read directly from a public dataset. Derived is arithmetic on those readings. Assumption is our judgement. "Disturbed" means any recorded loss of tree cover, clearing or degradation; it does not say why or by whom.
1What was checked
The EU regulation asks three questions of every plot. Was the land forest on 31 December 2020? Has it been deforested or degraded since? Is it farmed legally? We answer the first two with five independent forest layers and two loss records, and the third with protected-area boundaries.
| Question | Layer | Resolution and date | What it gets wrong |
|---|---|---|---|
| Forest at the cut-off | JRC Global Forest Cover 2020 V4, the EU's own reference map | 10 m, 2020 | Not legally binding. In Africa (V3) it wrongly calls 14.5% of non-forest forest and misses 17.3% of forest. Shade cocoa is its known weak spot |
| Forest at the cut-off | JRC Tropical Moist Forest | 30 m, 1990–2025 | Moist forest only; confirms recent clearing late |
| Forest at the cut-off | Hansen tree cover 2000 ≥ 10%, minus loss to 2020 | 30 m | Counts any tree canopy, cocoa included |
| Forest at the cut-off | ESA WorldCover, tree cover | 10 m, 2021 | One year after the cut-off; tree crops count as trees |
| Forest at the cut-off | ETH canopy height ≥ 5 m | 10 m, 2020 | A model; old cocoa under shade trees is taller than 5 m |
| Loss since | Hansen tree cover loss, 2021–2025 | 30 m, yearly | Any canopy removal, including replanting and harvest |
| Loss since | JRC TMF deforestation and degradation year, 2021–2025 | 30 m, yearly | Last two years provisional |
| Legality | World Database on Protected Areas | Polygons | Many Nigerian reserve outlines are old and approximate; not checked against gazettes |
The decision rules are the ones Kam Edge wrote for Kam Origin before this run, so the result could not be tuned to the data:
| Outcome | Rule |
|---|---|
| No forest 2020 | None of the five forest layers covers 10% of the plot, and no loss since 2020. |
| Treed 2020, review | Two or more layers agree the plot was under trees, and no loss since. Always reviewed: a farm on forest is a contradiction that a person, and often a drone flight, must settle. |
| Loss after 2020 | Two or more layers agree on forest, no earlier disturbance, and loss on 10% of the plot or 0.1 ha after 2020. Never an automatic fail. |
| Inconclusive | The layers disagree, the result changes if the boundary moves 10 m, the plot is under 0.3 ha, or old and new disturbance overlap. |
| Legality flag | Any overlap with a protected area, added to whatever outcome the plot has. |
One rule cannot be applied in Nigeria: telling a cocoa farm from forest directly. The only cocoa map that reaches Nigeria is published inside Google Earth Engine alone, and its training data contain no Nigerian cocoa. So the outcome "tree crop in 2020, not forest" is never reached here, and every treed farm goes to review. Assumption
2Twenty cocoa farms in Ondo
These are the only individually mapped cocoa farms we could find in public data for either state. A national survey (GRID3) recorded them as points; volunteers later put them on OpenStreetMap as identical 60 m squares. So each is a position, not a boundary. One, ON-01, was redrawn by hand in 2025. Cross River has none. Owners' names and exact positions are withheld here.
| Plot | LGA, ward | EU map 2020 | Layers saying forest (of 5) | Disturbed after 2020 | Protected area | Outcome |
|---|---|---|---|---|---|---|
| ON-01 | Akure North | Not forest 0% | 2 | 0% | None | Treed 2020, review |
| ON-02 | Akure North | Not forest 0% | 3 | 5% | None | Treed 2020, review |
| ON-03 | Akure South | Not forest 0% | 2 | 0% | None | Treed 2020, review |
| ON-04 | Ondo East | Forest 100% | 5 | 0% | None | Treed 2020, review |
| ON-05 | Ondo East | Forest 37% | 5 | 4% | None | Treed 2020, review |
| ON-06 | Ondo East | Forest 100% | 5 | 0% | None | Treed 2020, review |
| ON-07 | Ondo East | Forest 100% | 5 | 0% | None | Treed 2020, review |
| ON-08 | Idanre Isalu-Jigbokin | Not forest 0% | 4 | 26% | Idanre Forest Reserve | Inconclusive |
| ON-09 | Idanre Isalu-Jigbokin | Not forest 0% | 3 | 0% | Idanre Forest Reserve | Treed 2020, review |
| ON-10 | Idanre Isalu-Jigbokin | Not forest 0% | 4 | 0% | Idanre Forest Reserve | Treed 2020, review |
| ON-11 | Idanre Isalu-Jigbokin | Not forest 0% | 3 | 0% | Idanre Forest Reserve | Treed 2020, review |
| ON-12 | Idanre Idale-Lemikan | Not forest 0% | 4 | 0% | Akure-Ofosu Forest Reserve | Treed 2020, review |
| ON-13 | Idanre Idale-Lemikan | Not forest 0% | 4 | 0% | Akure-Ofosu Forest Reserve | Treed 2020, review |
| ON-14 | Idanre Idale-Lemikan | Forest 100% | 5 | 4% | None | Inconclusive |
| ON-15 | Idanre Idale-Lemikan | Forest 100% | 5 | 30% | None | Inconclusive |
| ON-16 | Idanre Ofosu-Onisere | Forest 93% | 5 | 0% | Idanre Forest Reserve | Treed 2020, review |
| ON-17 | Ile Oluji/Okeigbo Ileoluji 6 | Forest 100% | 5 | 0% | None | Treed 2020, review |
| ON-18 | Ile Oluji/Okeigbo Ileoluji 6 | Forest 100% | 5 | 0% | None | Treed 2020, review |
| ON-19 | Odigbo | Not forest 0% | 4 | 0% | Oluwa Forest Reserve | Treed 2020, review |
| ON-20 | Irele | Not forest 0% | 4 | 0% | None | Treed 2020, review |
- 8 farms are inside a forest reserve: ON-08, ON-09, ON-10, ON-11, ON-12, ON-13, ON-16, ON-19. 4 of them sit on land the JRC record shows as cleared or never moist forest, which would pass the deforestation test; the rest sit on degraded or standing forest. Either way they fail on legality unless the farmer holds a permit or the land has been de-reserved. Measured
- The EU map and the tree-cover maps disagree on most farms. 11 farms are not forest on the EU map, yet at least two other layers call each of them treed. That is shaded cocoa doing what it does to satellites. On these farms the EU map is the better witness for the farmer.
- 9 farms are forest on the EU map. Either the map is wrong about shade cocoa, the cocoa was planted under existing forest, or the point is not on the farm. A drone flight settles which. ON-04 is the plainest case: all five layers say intact or degraded forest.
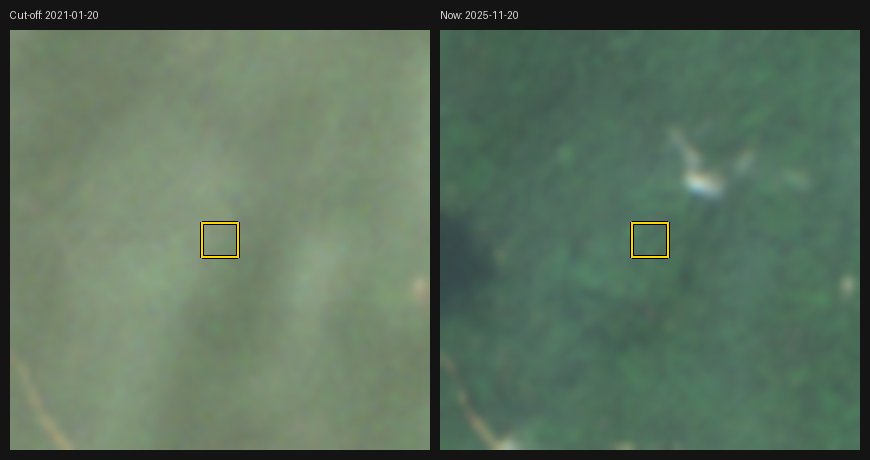
- ON-15 shows loss after the cut-off on 30% of the square, on land the EU map calls forest in 2020, 1 km outside Akure-Ofosu Forest Reserve. That is the pattern a competent authority would look for first. Measured
- ON-08 is both: inside Idanre Forest Reserve and disturbed after 2020 on 26% of the square.
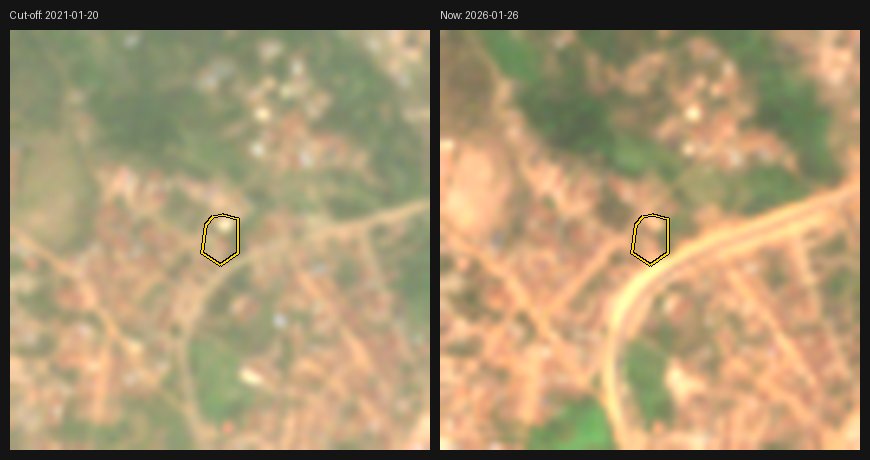
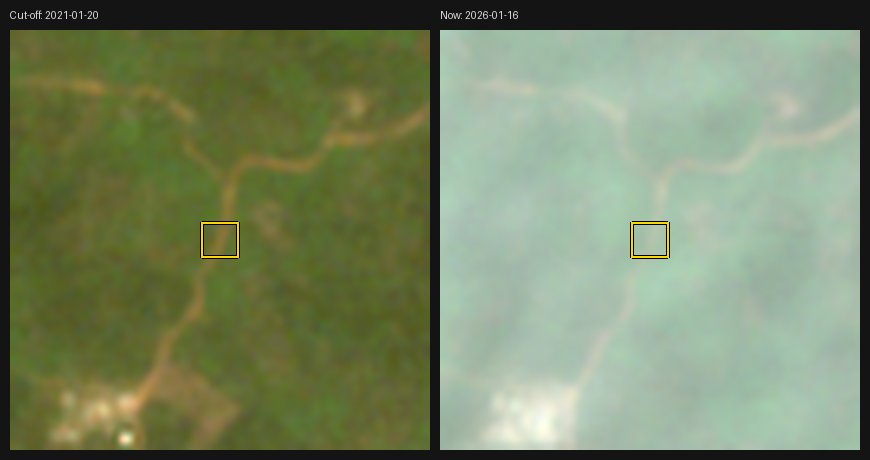
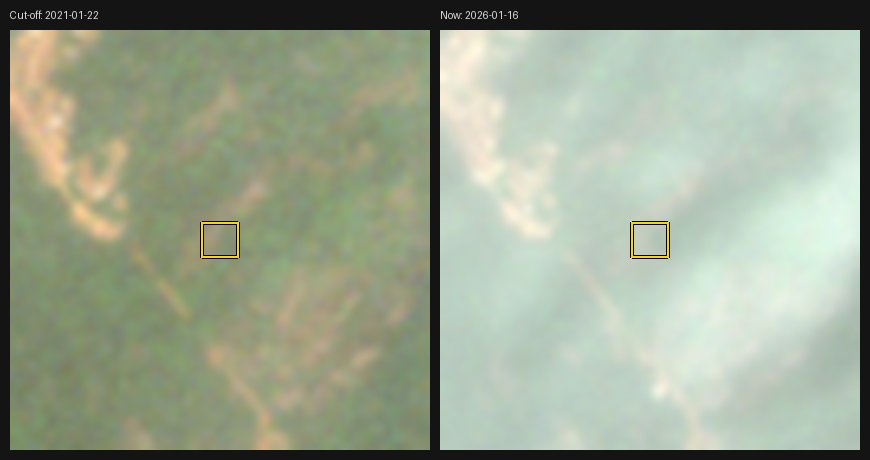
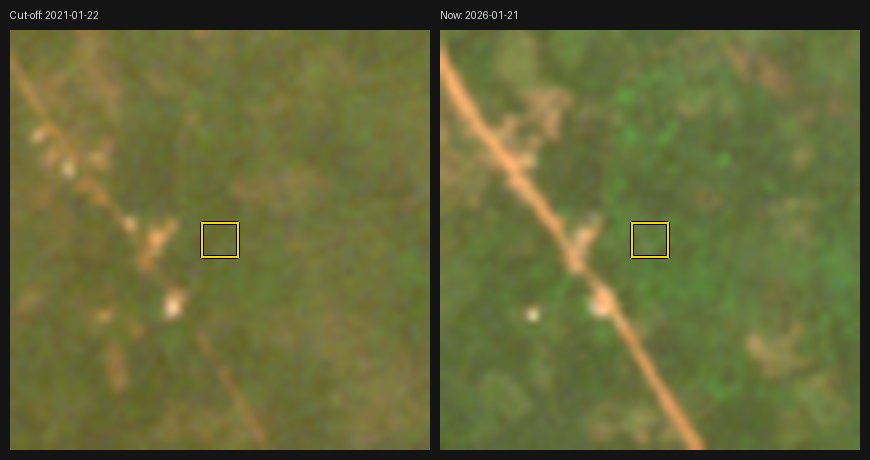
- ON-01 sits among houses. The cut-off and current images show a built-up area with a road cut beside it since 2021. A position can be wrong by a whole farm; this is why a walked boundary matters.
- Final status: inconclusive, all 20. Under the quality rules none of these can be cleared or failed, because none has a walked boundary: 19 are 60 m squares round survey points and 1 was drawn on imagery. The outcome column is what the evidence says before that rule.
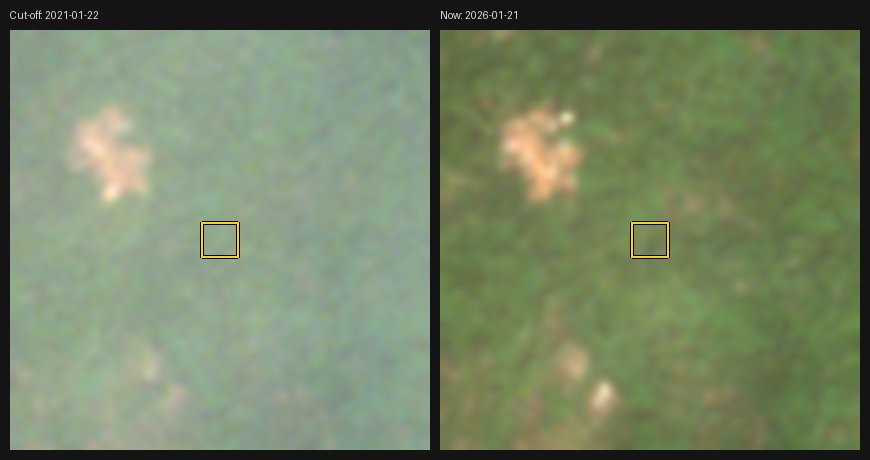
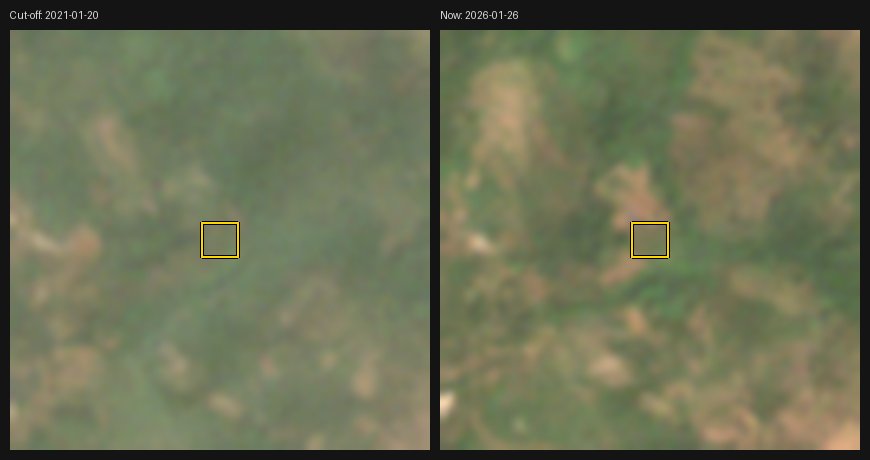
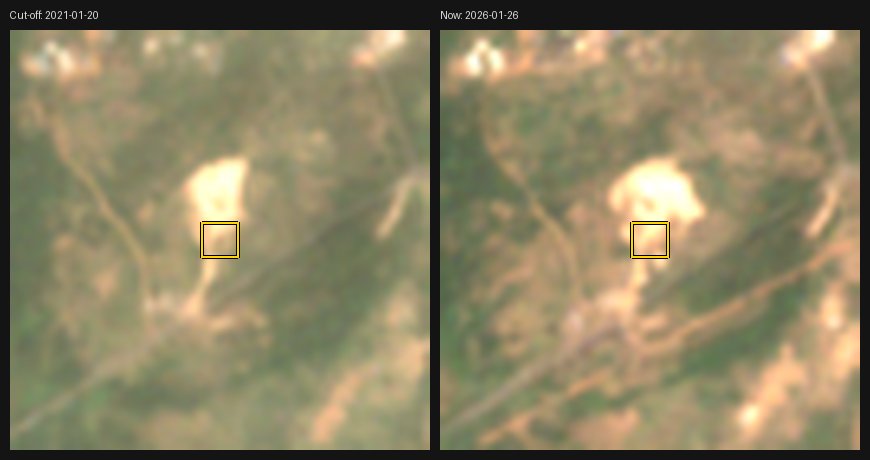
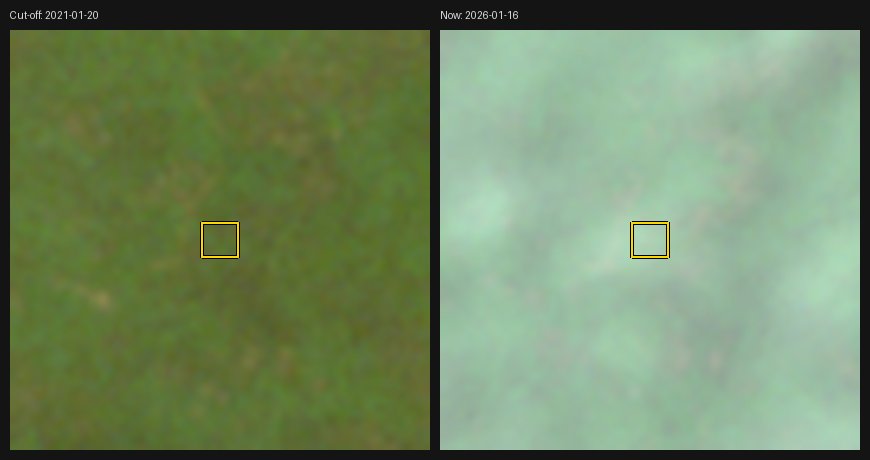
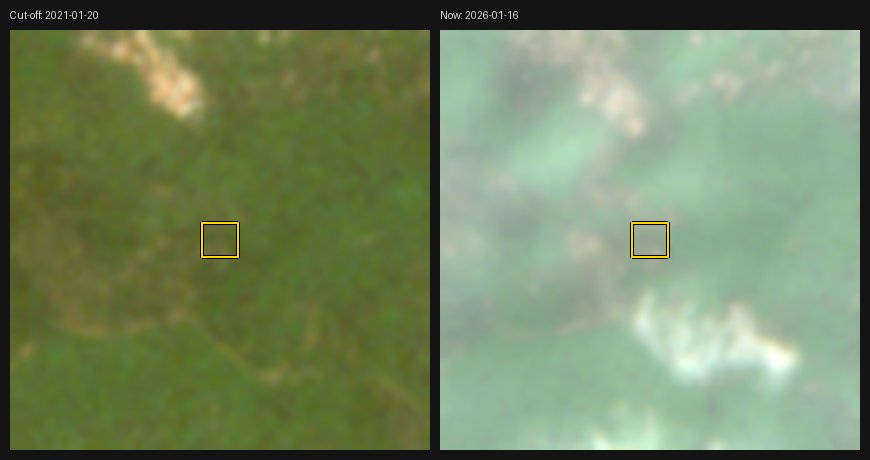
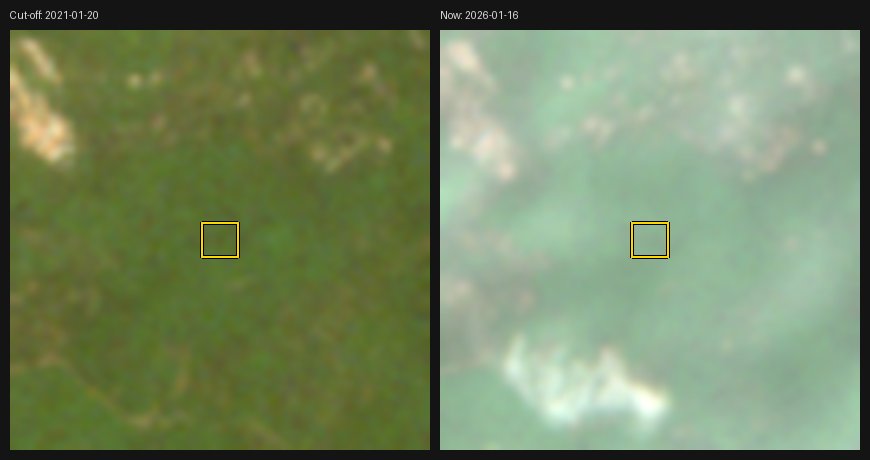
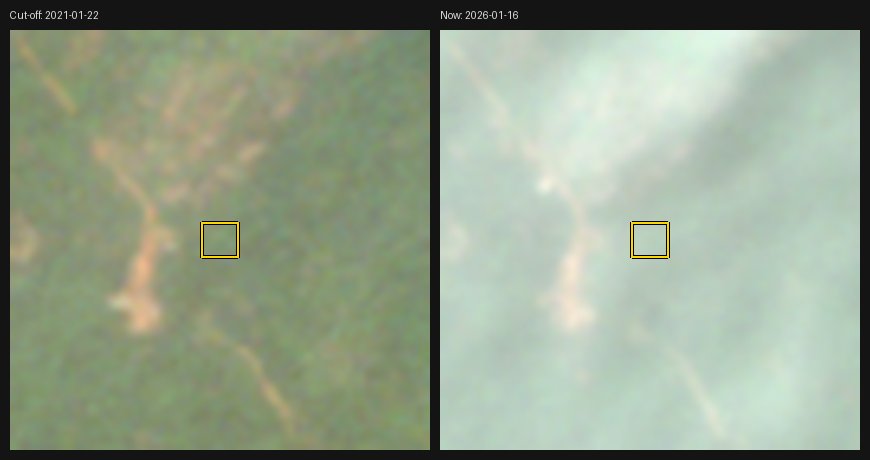
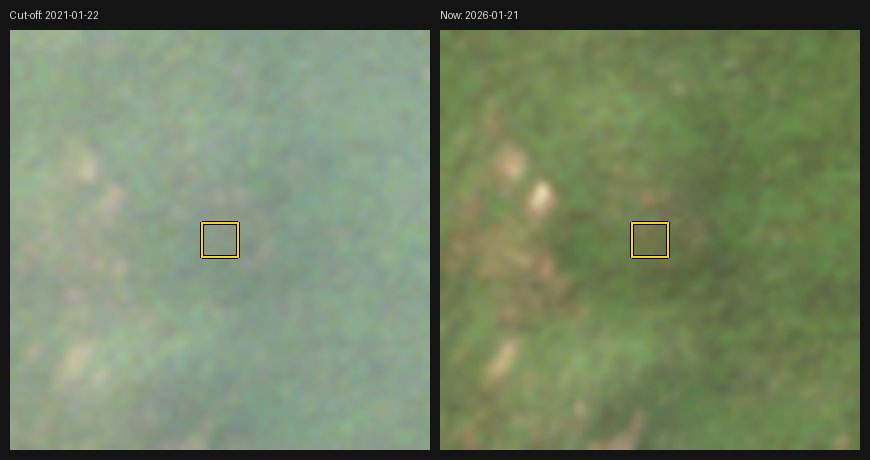
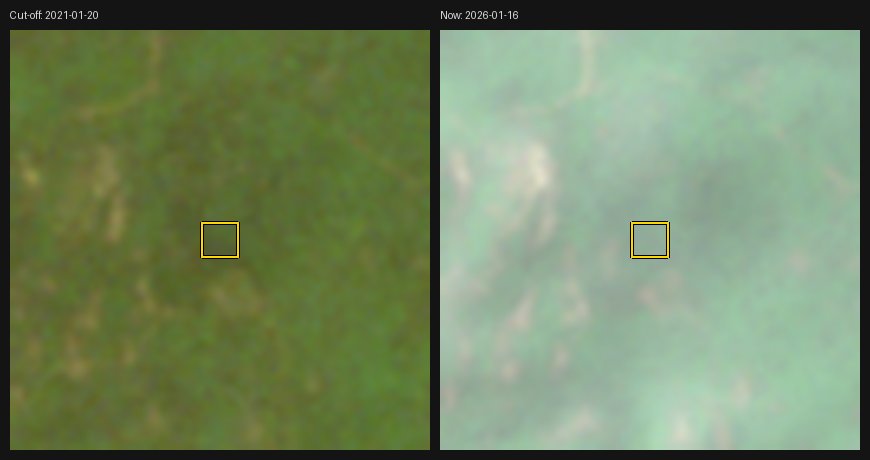
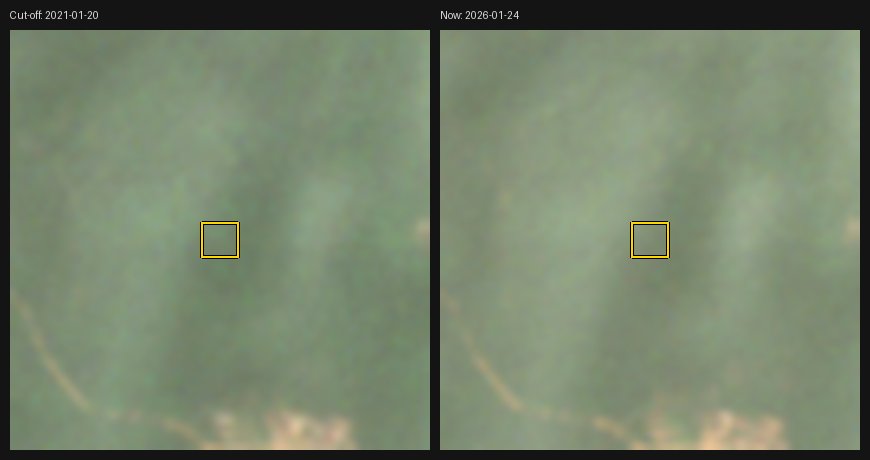
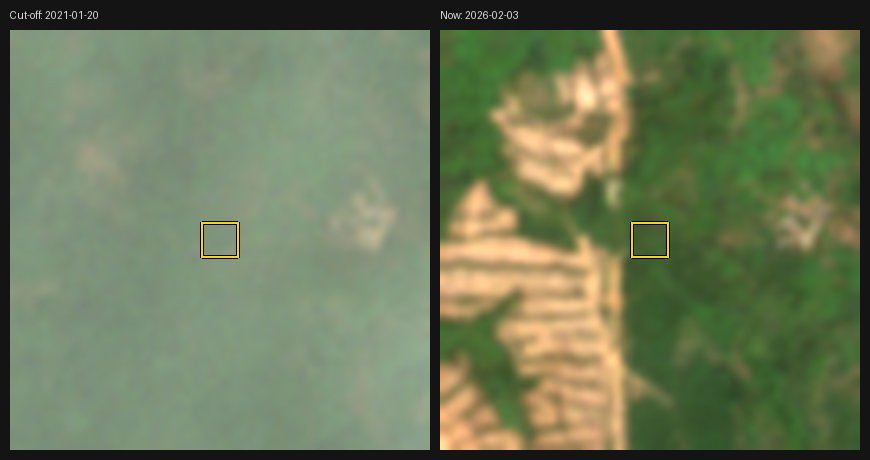
All 20 farms, cut-off and now
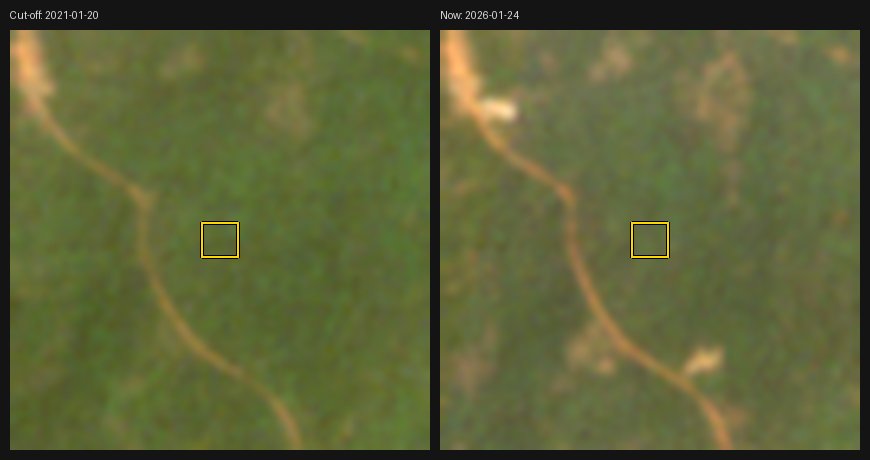
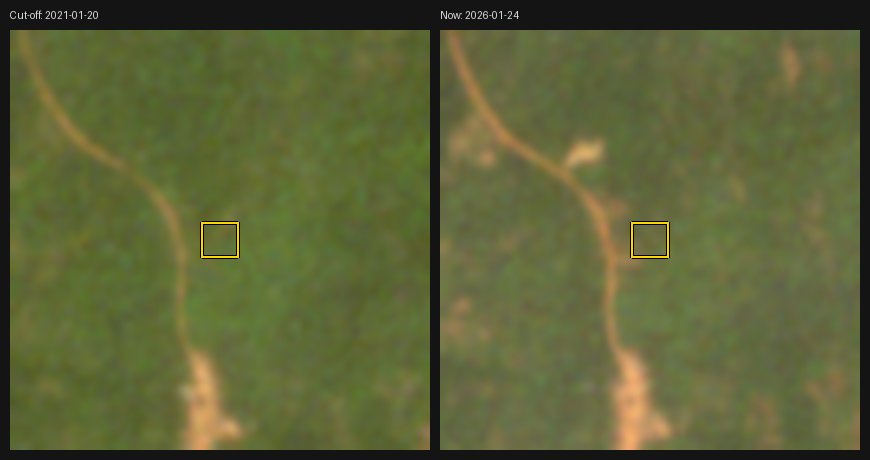
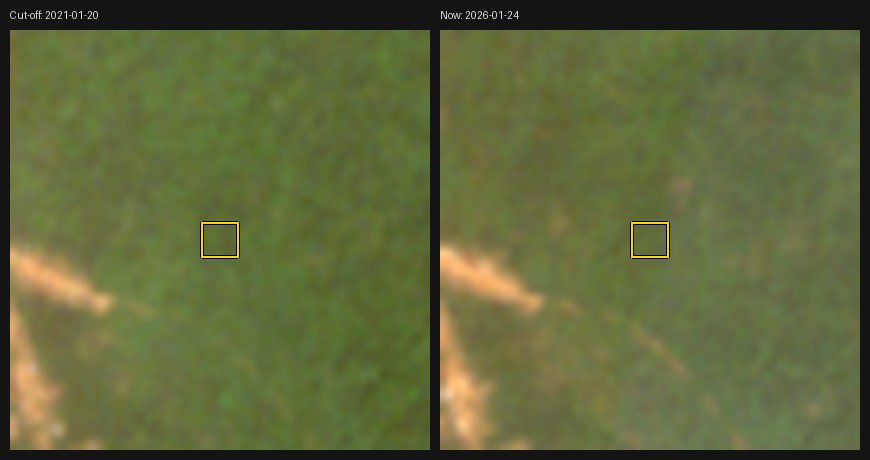
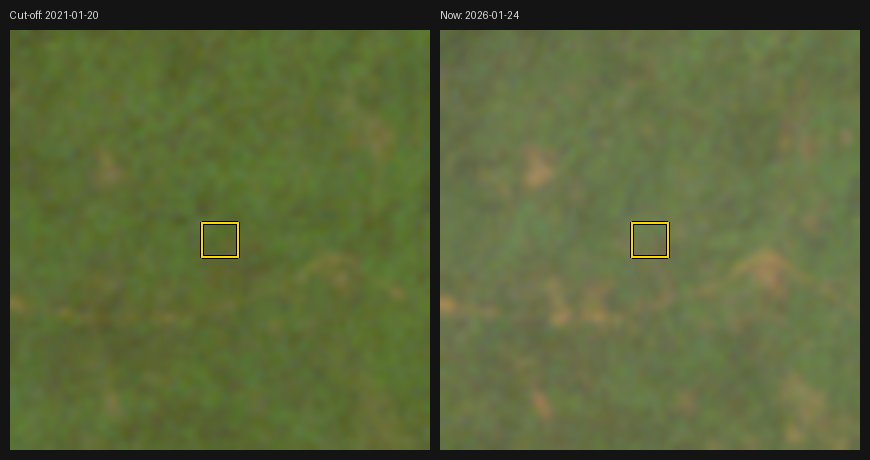
3Four cocoa estates
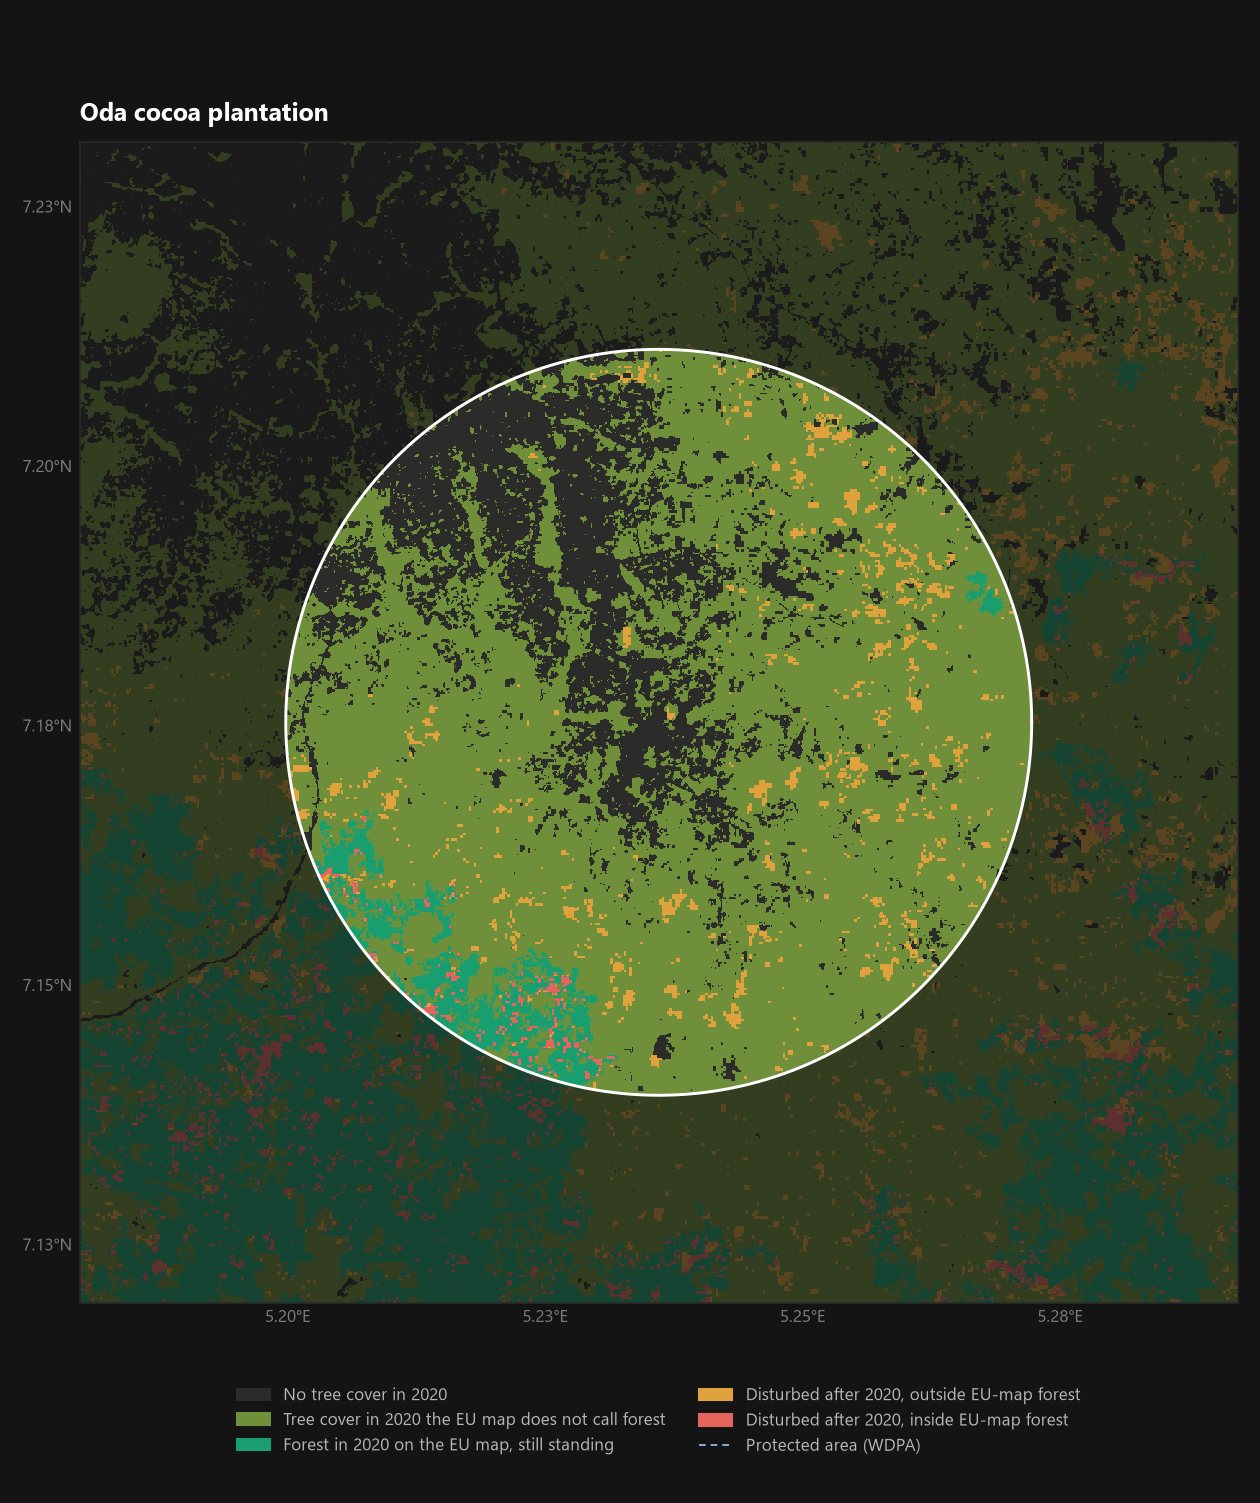
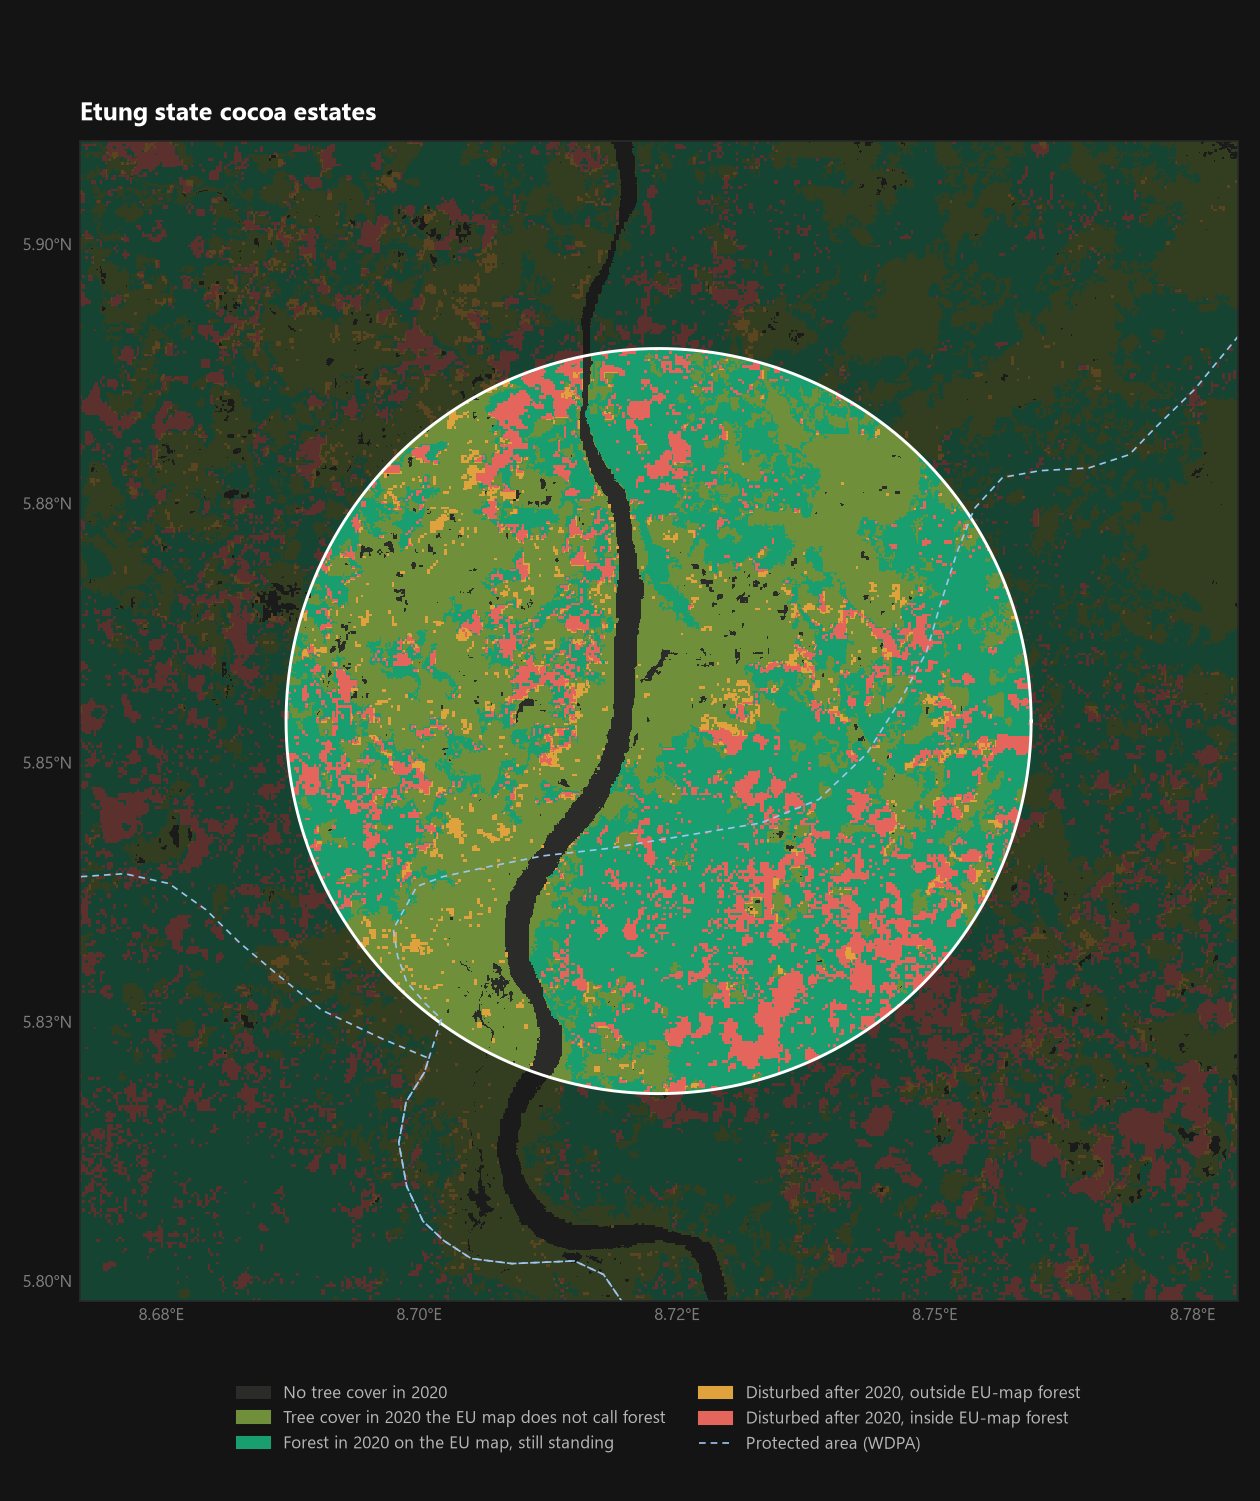
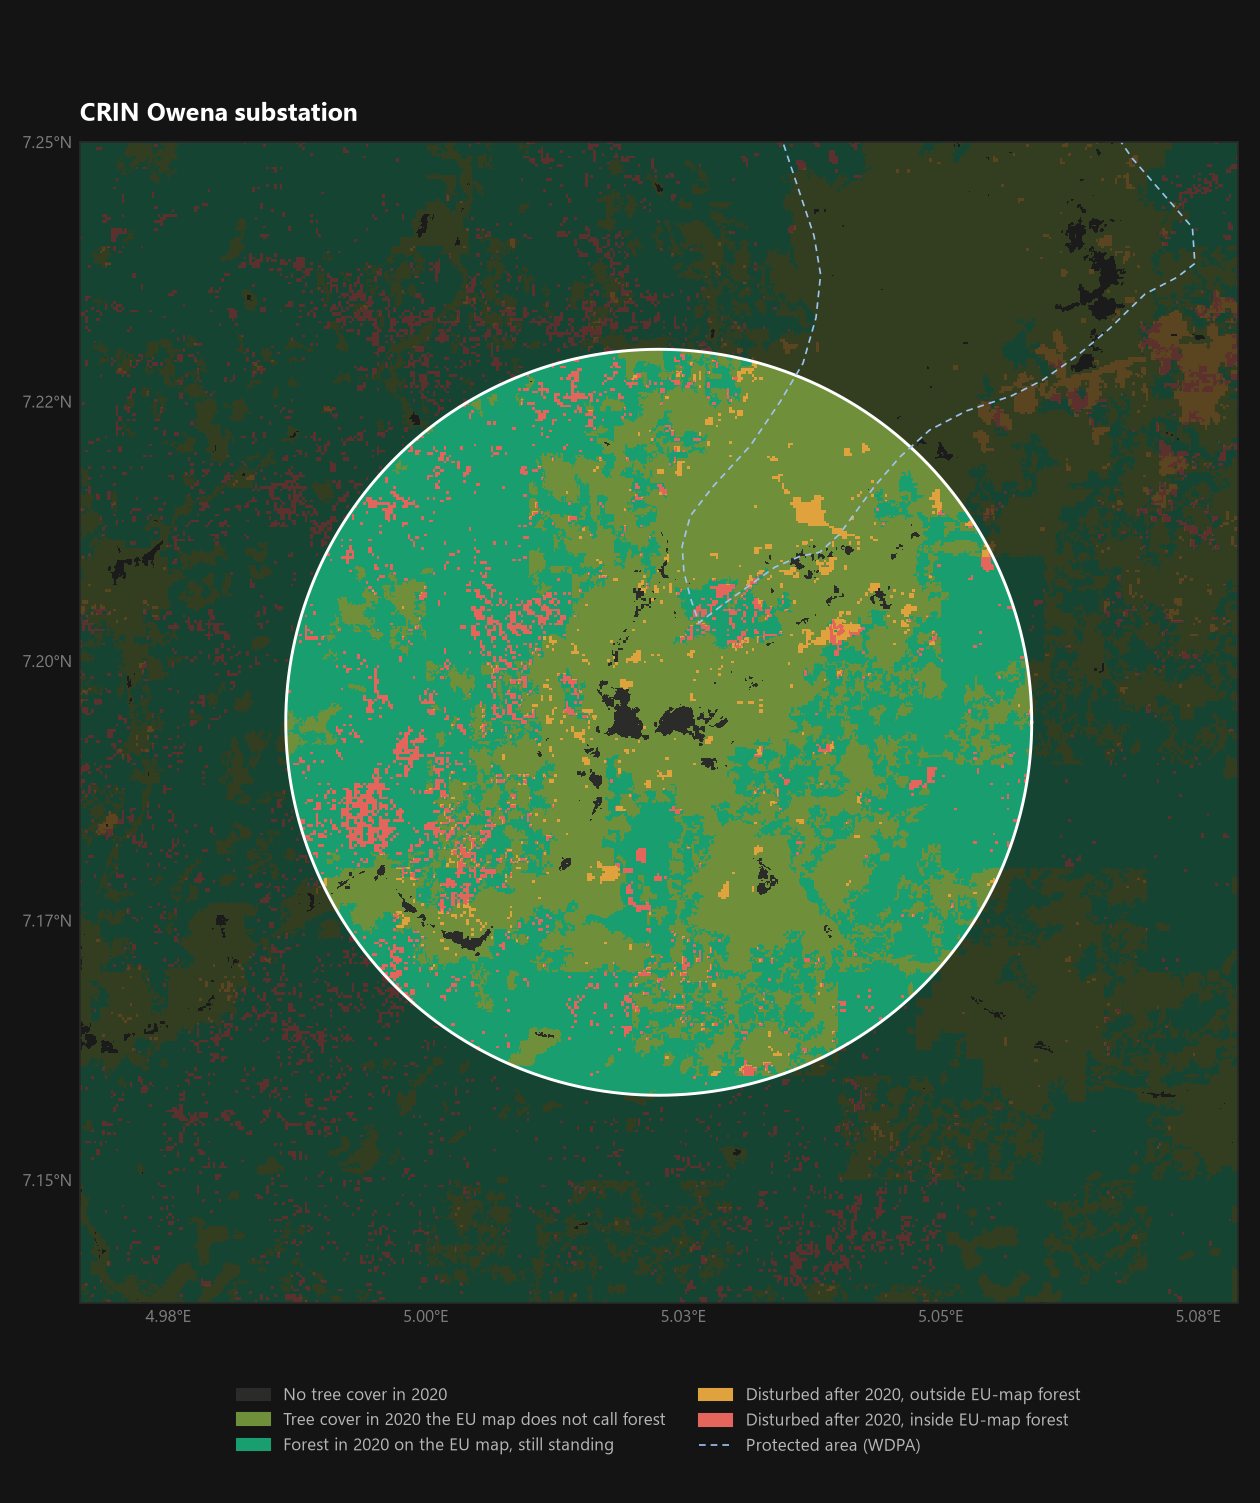
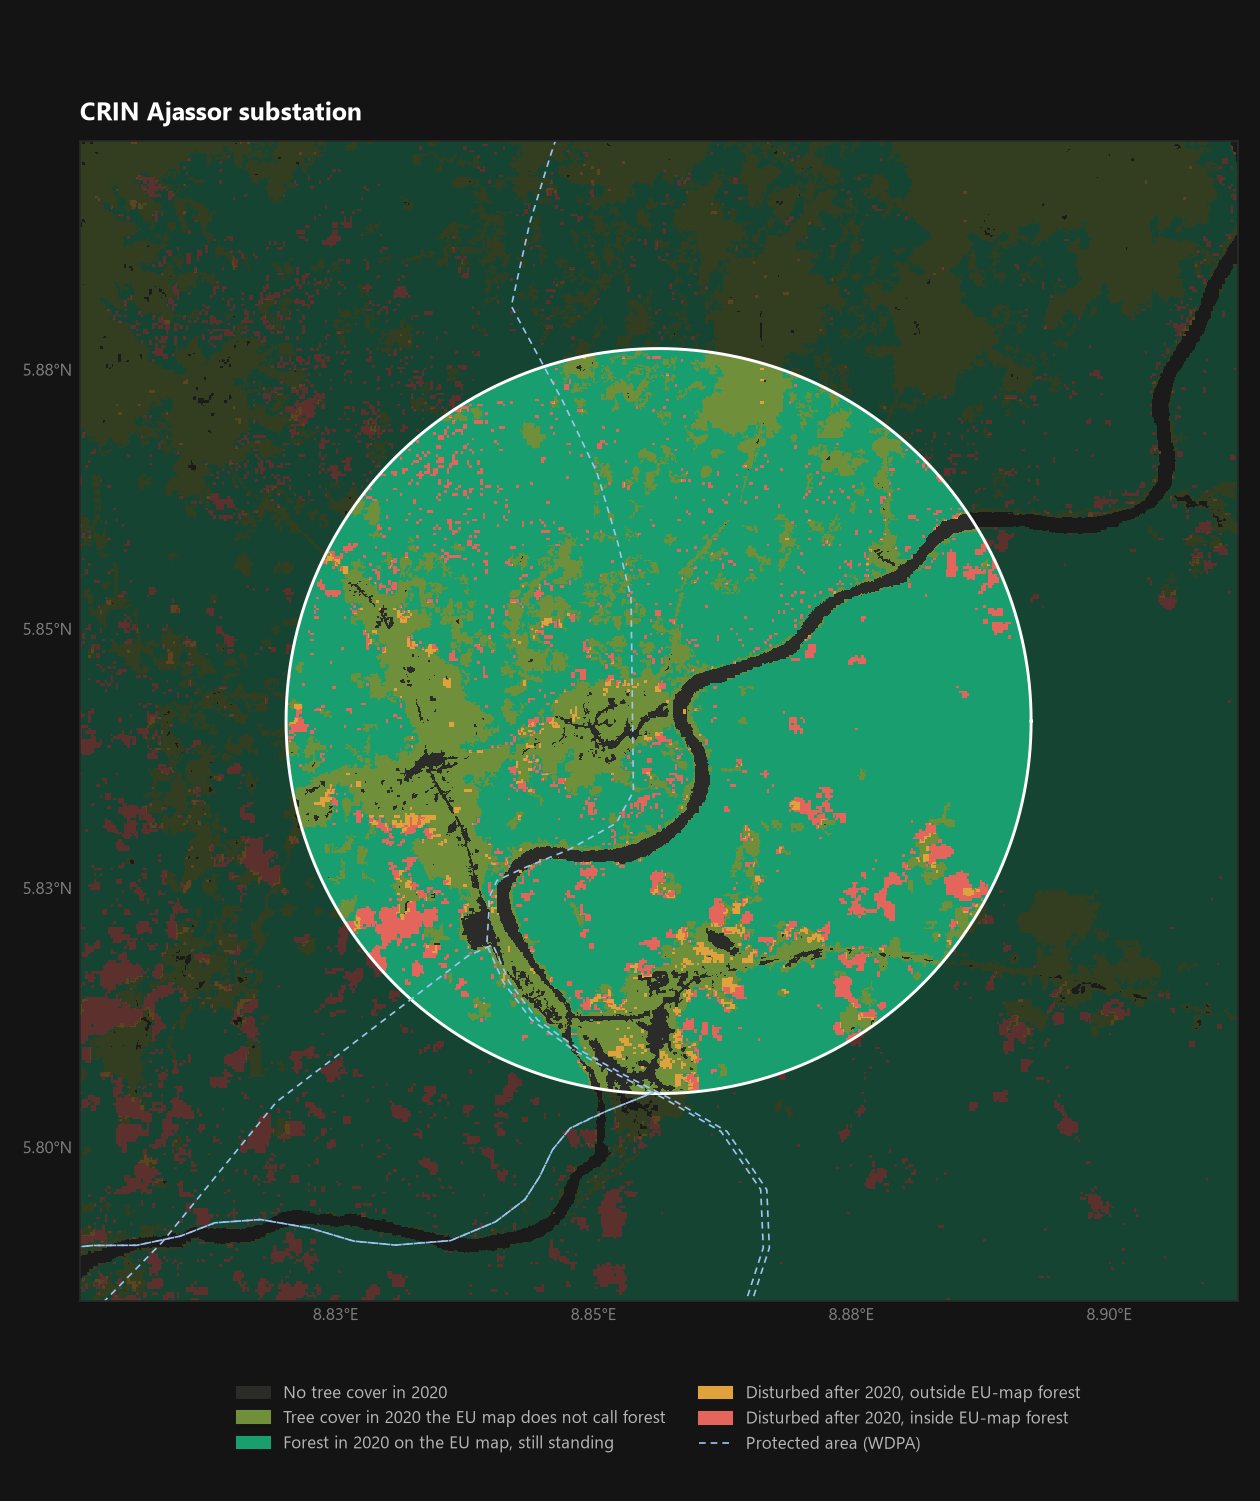
No estate in either state publishes its boundary. Each is measured here as a circle of 4 km radius (about 5,000 ha) around the village or town it is named after. The circle is a search window, not a boundary; the numbers describe the landscape the estate sits in.
| Site | Area, ha | EU-map forest, 2020 | Treed, not EU forest | Disturbed 2021–25, ha | …on EU-map forest, ha | Protected |
|---|---|---|---|---|---|---|
| Oda cocoa plantation | 4,994 | 4% | 75% | 205 | 24 | 0% |
| CRIN Owena substation | 4,994 | 52% | 47% | 334 | 238 | 6% |
| Etung state cocoa estates | 4,994 | 54% | 42% | 835 | 668 | 36% |
| CRIN Ajassor substation | 4,993 | 74% | 22% | 333 | 263 | 38% |
- Ondo and Cross River look different from space. Around Oda the EU map calls only 4% forest, and 75% of the window is tree cover it does not count as forest: an old cocoa belt. Around the Etung estates and Ajassor, 54% and 74% is EU-map forest. Cross River cocoa grows next to, and inside, real forest. Measured
- The Etung estates are the riskiest landscape. 835 ha, 17% of the window, has been disturbed since 2020, 668 ha of it on EU-map forest, and 36% of the window lies inside Cross River North Forest Reserve. Cocoa bought "from the Etung estates" needs plot boundaries before it can be placed on the EU market. Derived
- CRIN Ajassor sits in the same pattern: 38% of its window is protected land, and 263 ha of EU-map forest has been disturbed since 2020.
- CRIN Owena is mostly mature tree cover (17.5 m mean canopy), with most post-2020 disturbance recorded as degradation in 2021 and 2022 rather than clearing.
4Cocoa inside forest reserves
Each of these reserves has cocoa farming inside it documented by others (Section 7). Satellite layers cannot tell cocoa from other tree crops here, so the figures below are disturbance of every kind, not cocoa expansion alone.
| Site | Area, ha | EU-map forest, 2020 | Treed, not EU forest | Disturbed 2021–25, ha | …on EU-map forest, ha | Protected |
|---|---|---|---|---|---|---|
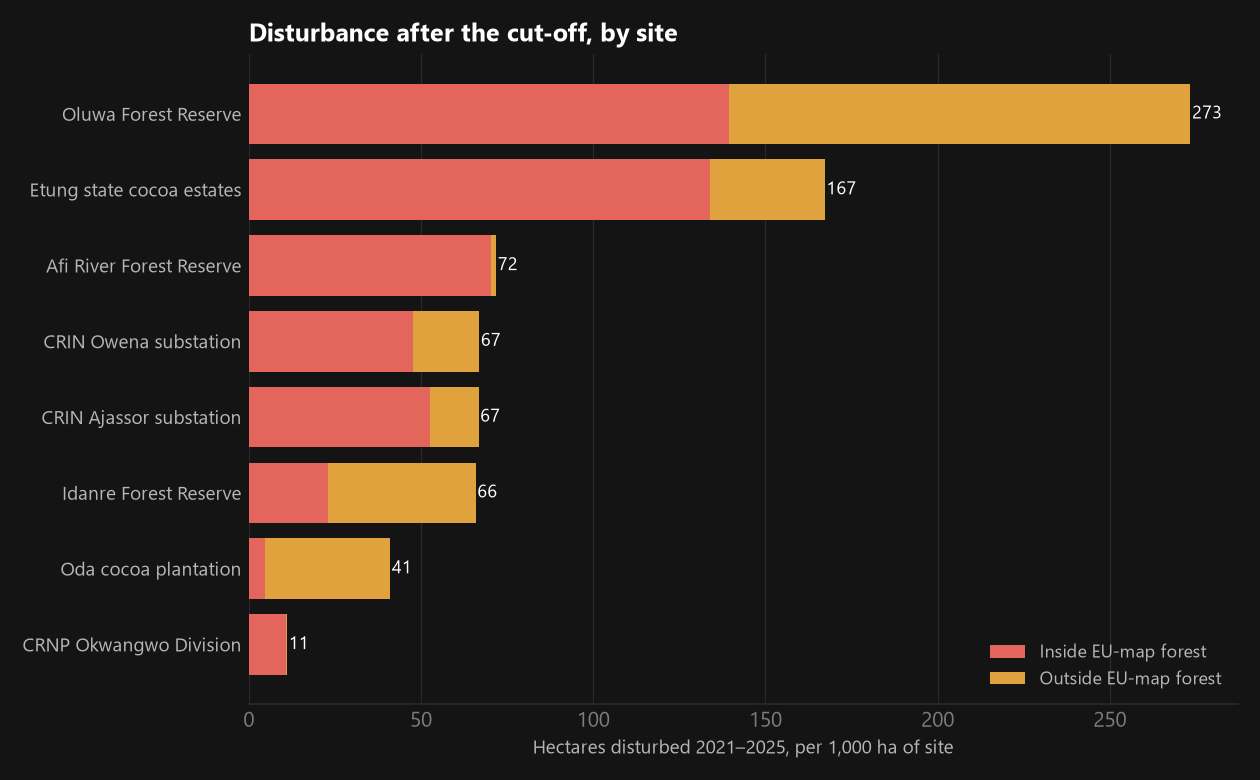
| Idanre Forest Reserve | 55,779 | 17% | 83% | 3,673 | 1,280 | 100% |
| Oluwa Forest Reserve | 82,364 | 53% | 45% | 22,516 | 11,475 | 100% |
| Afi River Forest Reserve | 31,018 | 98% | 2% | 2,227 | 2,182 | 100% |
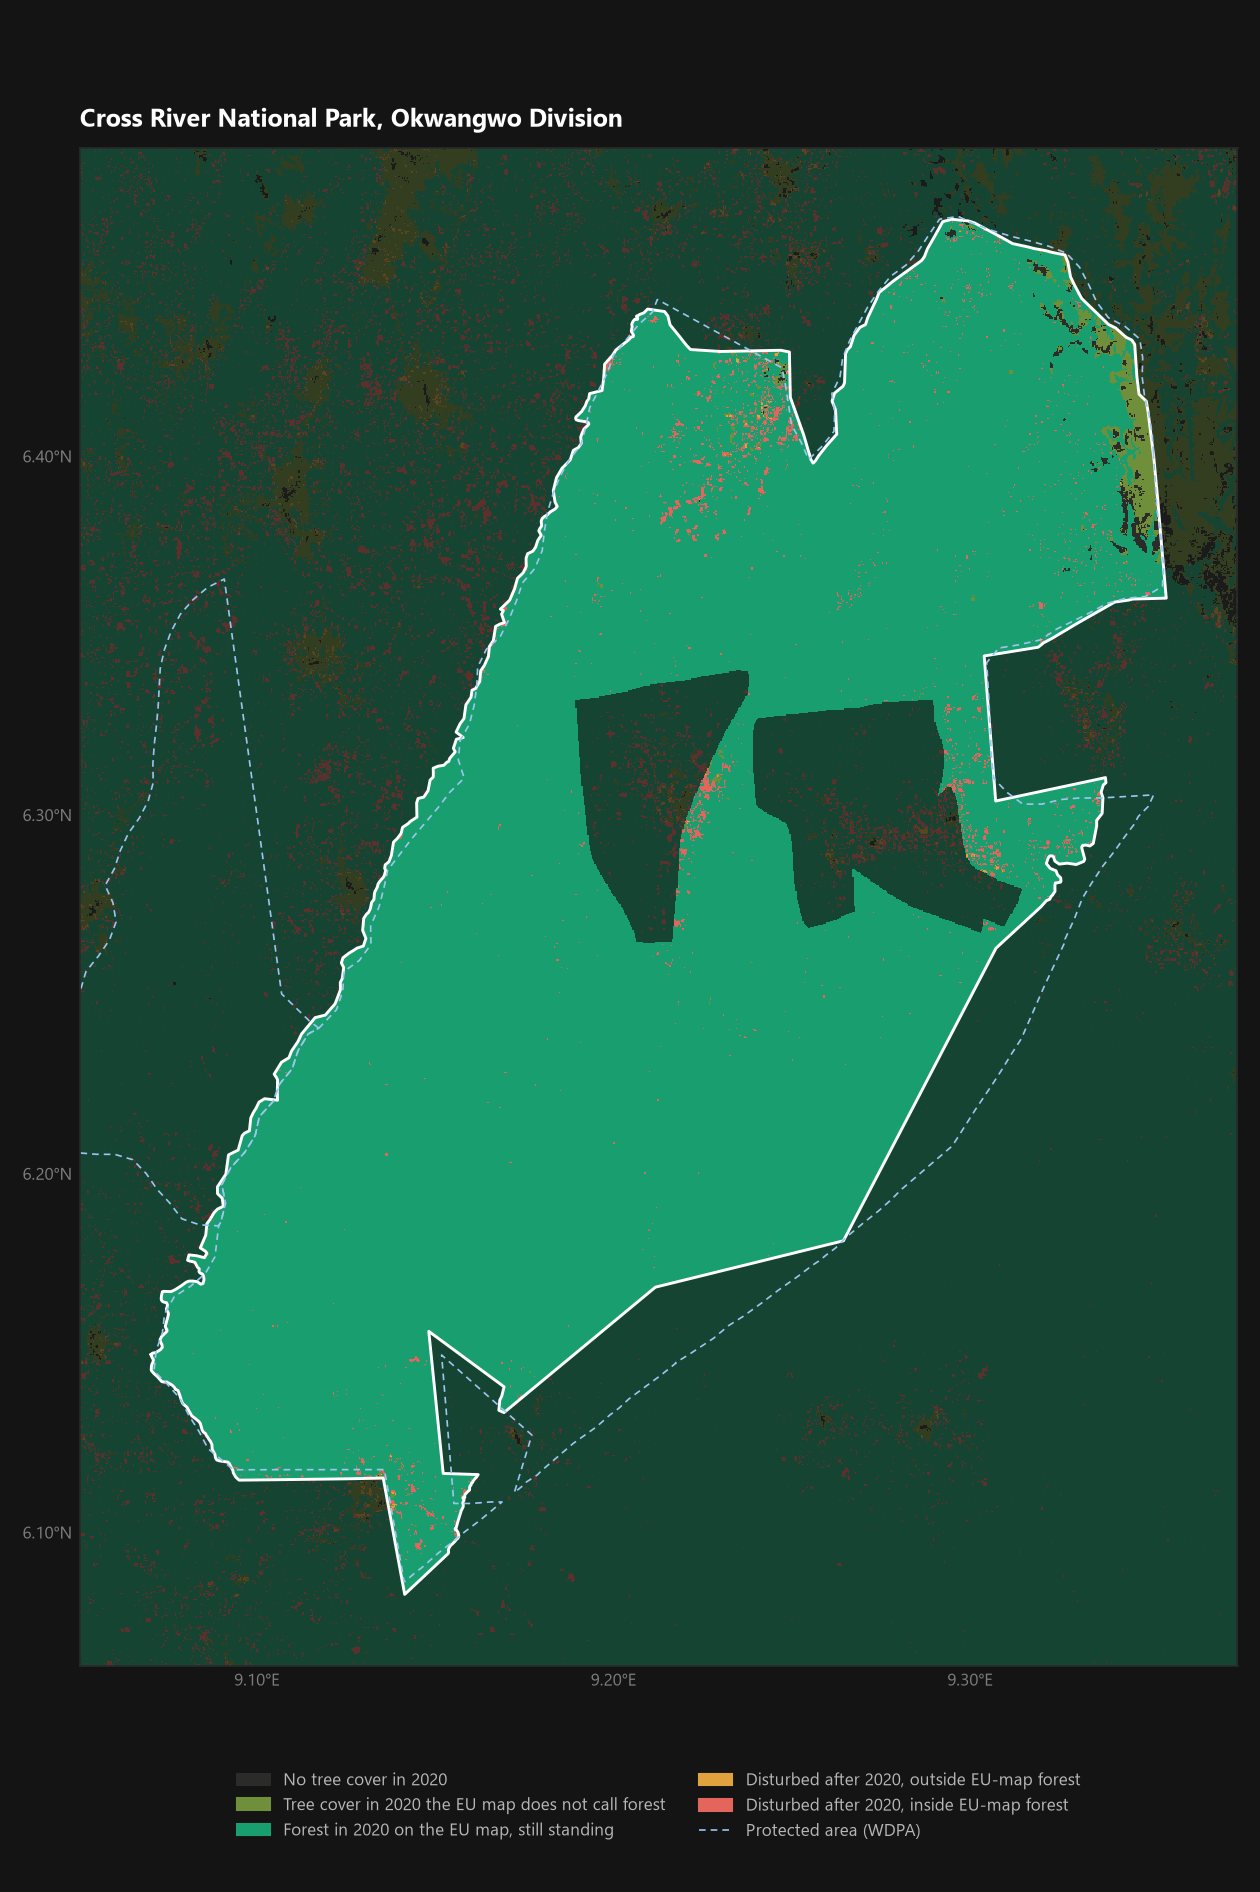
| Cross River National Park, Okwangwo Division | 57,065 | 99% | 1% | 635 | 619 | 98% |
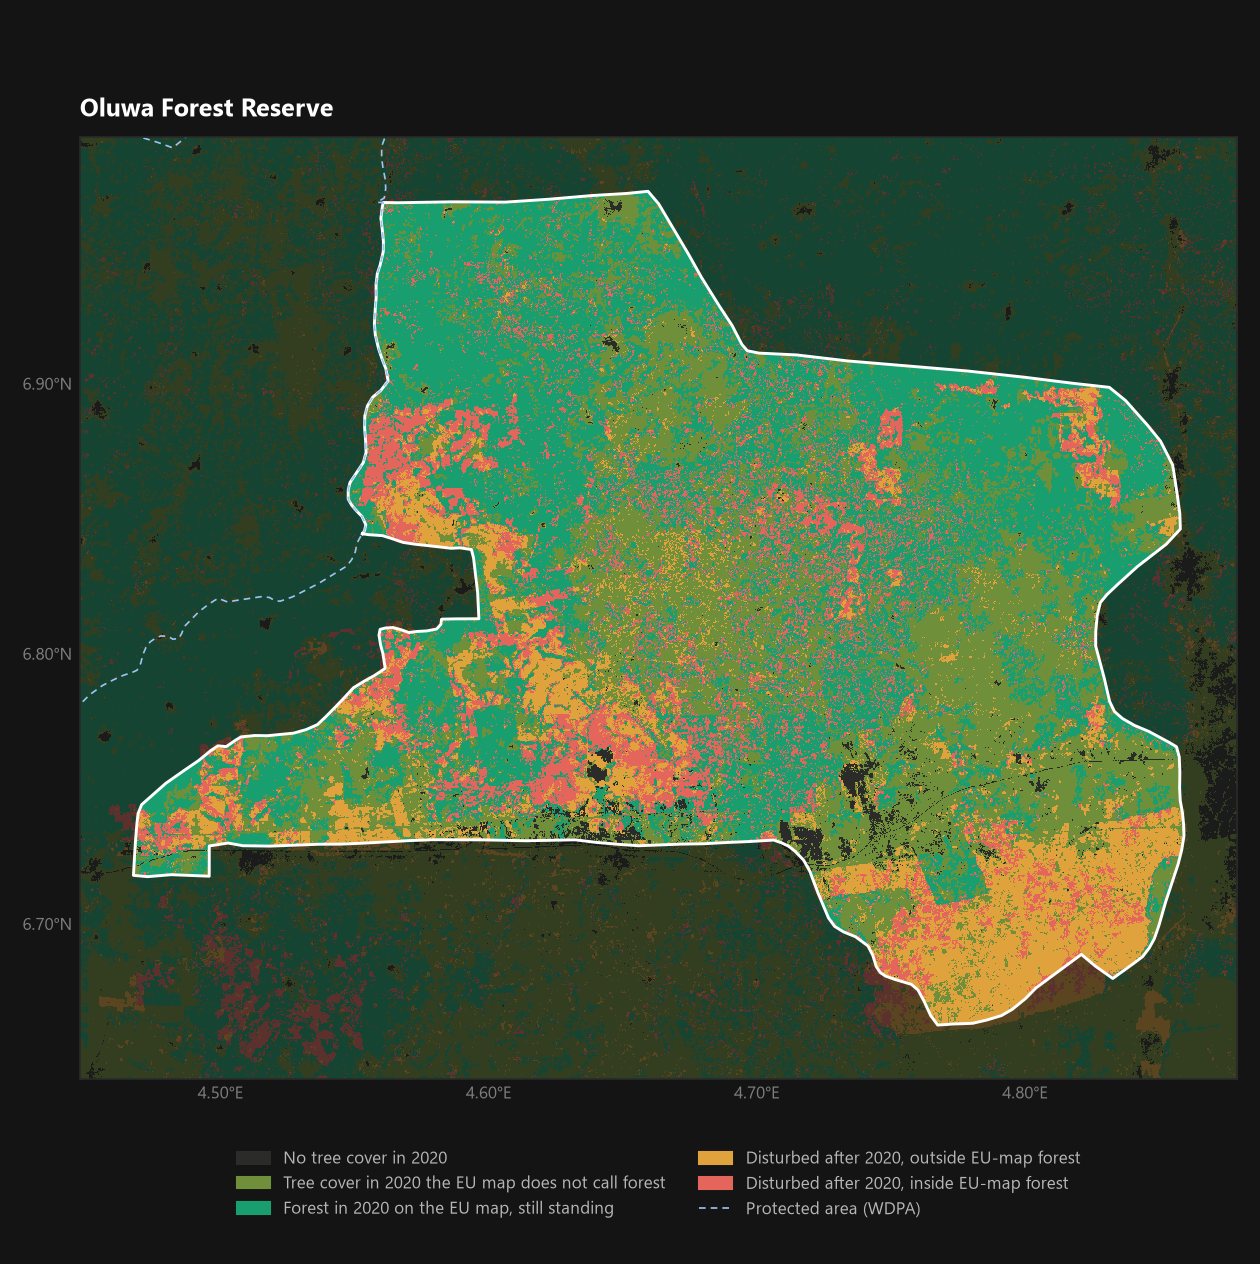
- Oluwa is losing tree cover fastest: 17,186 ha of tree cover lost from 2021 to 2025, about 3,437 ha a year, 11,475 ha of it on EU-map forest. Part of the reserve is under an oil palm concession that is in dispute with cocoa farmers, so not all of this is cocoa. Measured Assumption
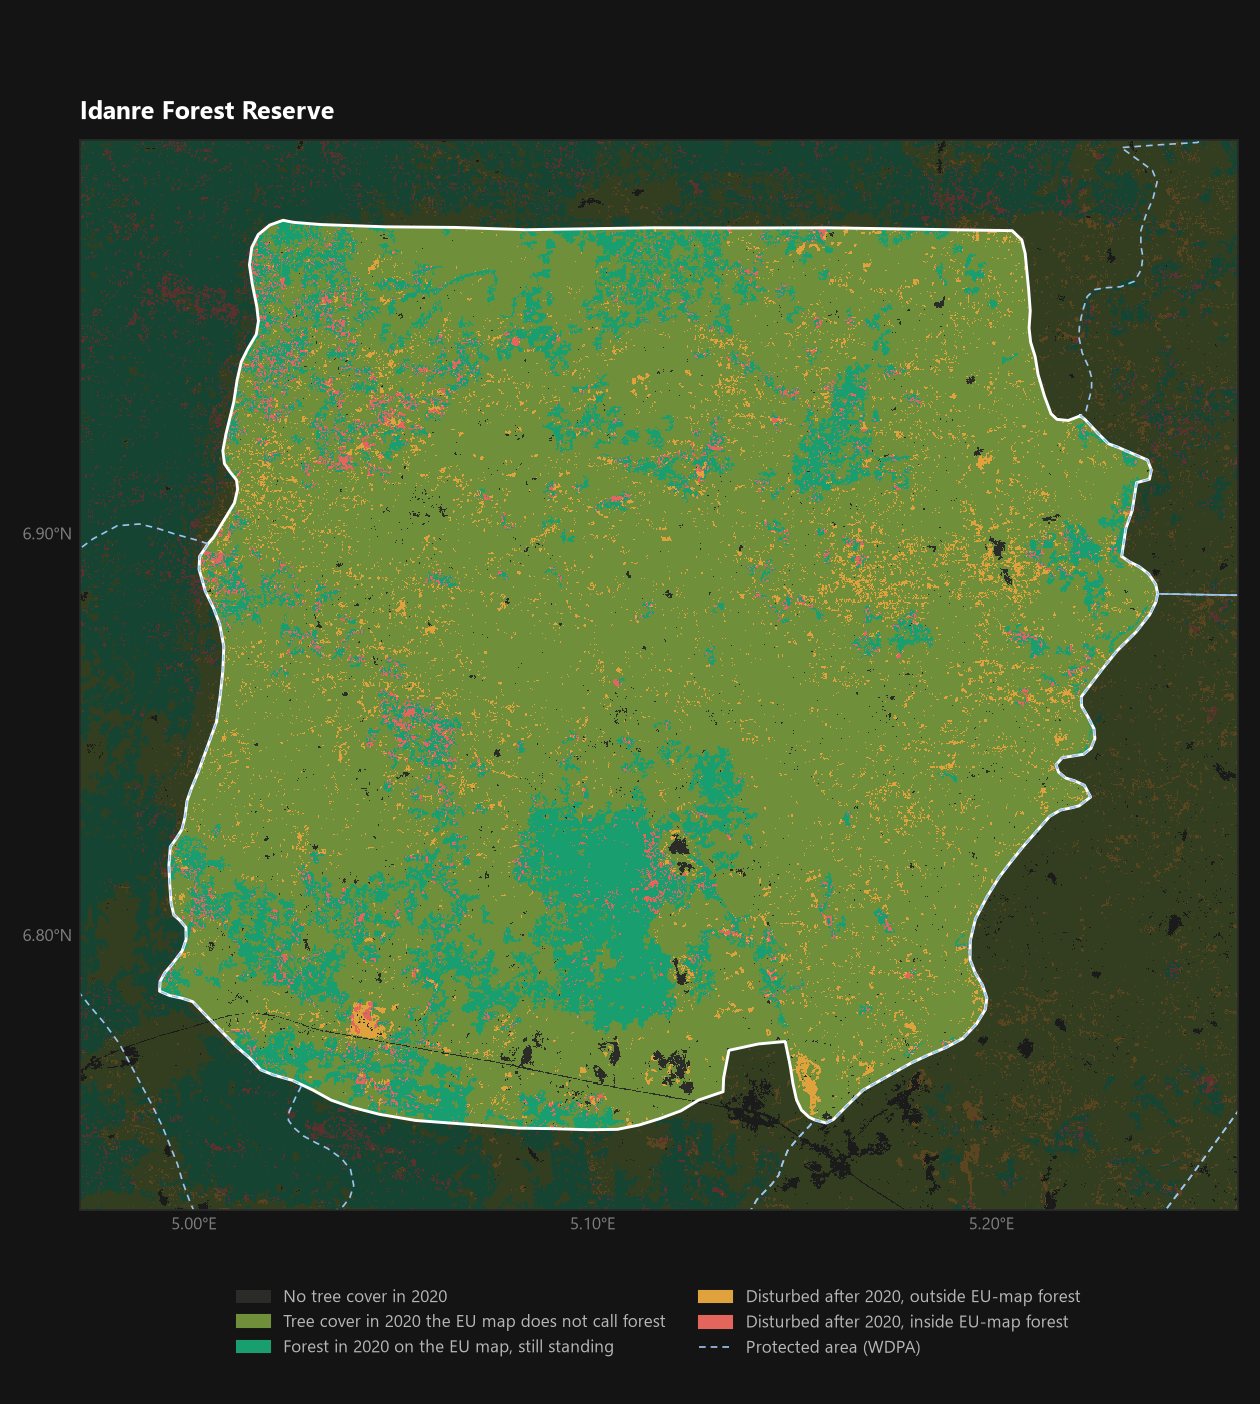
- Idanre is largely farmed already. The EU map calls only 17% of it forest, and the JRC record shows 43% has been cleared, nearly all of it before 2020. Cocoa from inside Idanre would mostly pass the cut-off test and fail on legality.
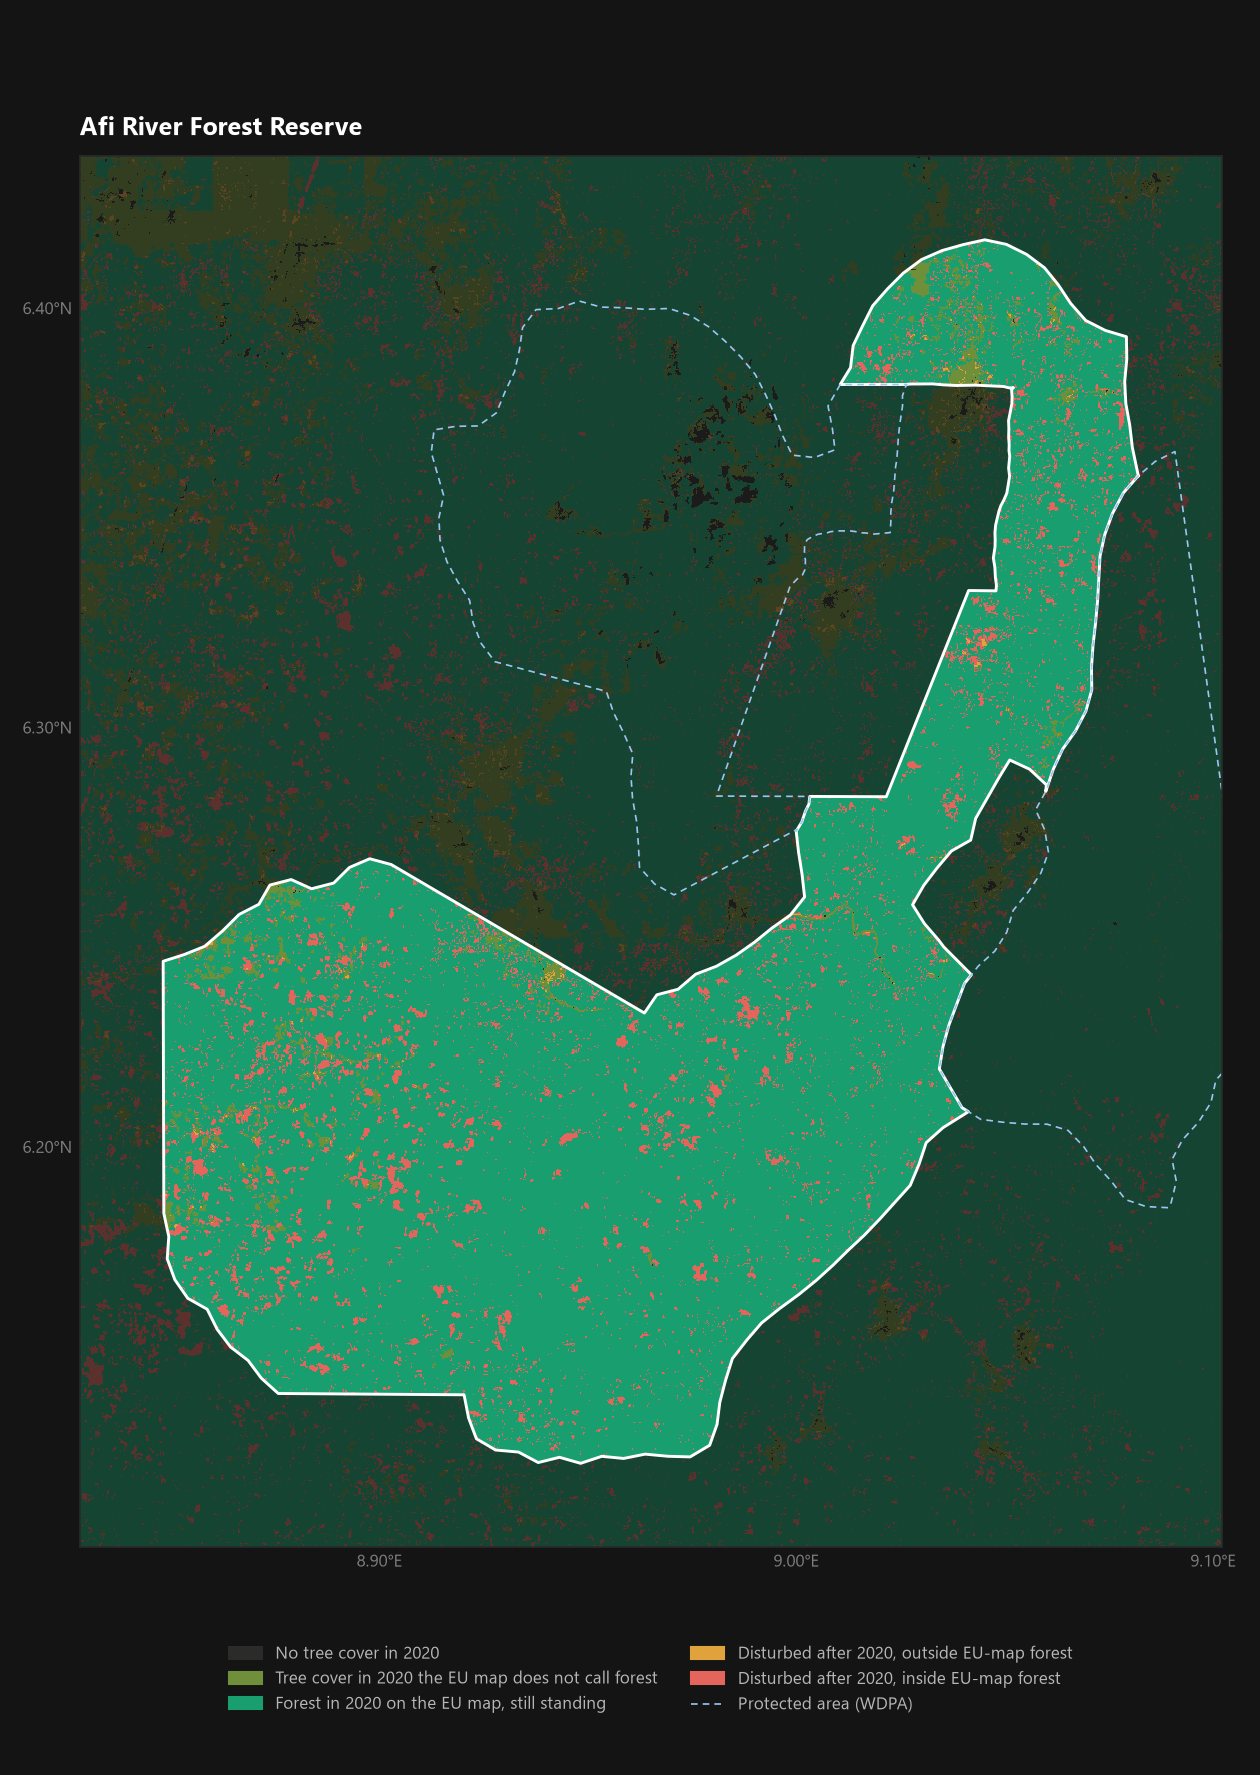
- Afi River is still forest: 98% EU-map forest and 80% undisturbed. Since 2020, 2,227 ha has been disturbed, mostly degradation, with Hansen loss rising to 258 ha in 2025. Measured New cocoa here would fail both tests. Assumption
- Okwangwo, in Cross River National Park, is the most intact site: 94% undisturbed forest, and 635 ha disturbed since 2020, 1.1% of its forest. The cocoa trespass reported there does not yet show as loss at this scale; small clearings under a closed canopy can be missed by 30 m data. Measured
Disturbance by year, 2021 / 2022 / 2023 / 2024 / 2025, hectares
| Site | Hansen tree cover loss | JRC clearing | JRC degradation |
|---|---|---|---|
| Oda cocoa plantation | 44 / 6 / 13 / 40 / 47 | 13 / 10 / 1 / 2 / 1 | 21 / 10 / 1 / 0 / 4 |
| CRIN Owena substation | 21 / 9 / 7 / 7 / 29 | 6 / 5 / 2 / 1 / 2 | 157 / 70 / 6 / 0 / 17 |
| Etung state cocoa estates | 43 / 98 / 46 / 48 / 78 | 82 / 79 / 63 / 38 / 5 | 185 / 68 / 80 / 19 / 78 |
| CRIN Ajassor substation | 14 / 32 / 19 / 54 / 43 | 24 / 16 / 17 / 17 / 4 | 70 / 13 / 22 / 12 / 31 |
| Idanre Forest Reserve | 214 / 116 / 101 / 69 / 191 | 198 / 450 / 91 / 46 / 11 | 334 / 1,641 / 123 / 19 / 189 |
| Oluwa Forest Reserve | 2,872 / 4,391 / 4,017 / 2,620 / 3,285 | 508 / 1,288 / 721 / 665 / 562 | 432 / 3,938 / 330 / 66 / 356 |
| Afi River Forest Reserve | 131 / 119 / 62 / 87 / 258 | 48 / 46 / 64 / 212 / 14 | 344 / 258 / 162 / 416 / 398 |
| Cross River National Park, Okwangwo Division | 36 / 40 / 36 / 10 / 36 | 14 / 10 / 27 / 34 / 1 | 63 / 80 / 119 / 149 / 43 |
Several sites show a jump in JRC degradation in 2022. We could not tell from these data whether that is a real event, such as a fire or logging season, or a feature of the record. The 2024 and 2025 JRC figures will rise as the record confirms them.
5What it means for buyers and for Kam Origin
- Legality, not deforestation, is the larger risk for Nigerian cocoa. Most of the cocoa land tested was already cocoa before 2020. But 8 of 20 mapped farms, and a third of the land round two Cross River estates, sit inside forest reserves. No satellite resolves that; permits, de-reservation records and boundary checks do.
- The EU's own map is kinder to Ondo cocoa than tree-cover maps are. A buyer running only a tree-cover tool would flag farms the EU map clears. A buyer running only the EU map would miss what it calls forest in error. Showing both, side by side, is the honest answer.
- Points are not enough. All 20 farms end inconclusive because none has a walked boundary, and one point sits in a town. Above 4 ha the regulation requires a polygon; below it, a wrong point is still a wrong farm.
- What a field visit settles that space cannot: a walked boundary; photos of cocoa trees old enough to predate 2021; a drone image under the canopy; the farmer's account of the land and any permit; and a yield check that the tonnage sold could have come from this farm.
- Where Kam Origin would start: the farms the EU map calls forest, and the Etung estates. Those are the cases a buyer cannot clear from a desk.
6Limits
- Nothing on this page is a compliance finding. The importer placing cocoa on the EU market remains responsible, and the JRC map is "non-mandatory, non-exclusive and not legally binding".
- No farm was visited and no farmer was asked. The 20 farms are survey points of unknown date and accuracy.
- Estate windows are circles round village points, not estate boundaries.
- Reserve outlines are from the World Database on Protected Areas and OpenStreetMap, not gazettes. Nigerian reserve outlines in that database are often old.
- No layer here can tell cocoa from other tree crops or from forest. Accuracy has not been measured in Nigeria by anyone we could find.
- WorldCover is from 2021, a year after the cut-off.
7Sources
| Source | Used for |
|---|---|
| JRC Global Forest Cover 2020 V4 (Bourgoin et al., doi 10.2905/JRC.3KATEH8), CC BY 4.0 | EU reference forest map |
| JRC Tropical Moist Forest v1, 1990–2025 | Forest condition, clearing and degradation years |
| Hansen Global Forest Change 2025 v1.13 | Tree cover 2000, loss years |
| ESA WorldCover 2021 v200 | Land cover |
| ETH Global Canopy Height 2020 | Canopy height |
| ESA CCI Biomass v6, 2022 | Mean biomass (not reported) |
| Copernicus Sentinel-2 L2A via Earth Search | Cut-off and current images |
| World Database on Protected Areas, UNEP-WCMC; OpenStreetMap (ODbL) | Reserve and park boundaries |
| GRID3 Nigeria farm survey, as imported to OpenStreetMap (ODbL) | The 20 farm positions |
| CRIN Owena, CRIN Ajassor | Research stations |
| ICIR on the Oda plantation | Oda estate |
| Cross River State Government, Etung estates | Etung estates |
| Farmlandgrab, Sahara Reporters | Cocoa camps and concession in Oluwa |
| Vanguard, Nov 2025 | Cocoa farming in Ondo reserves |
| Earthsight, Mongabay, 2023 | Cocoa clearing in Afi River |
| Pulitzer Center, 2025 | Cocoa farming in Cross River National Park |