Reserve Baseline · desk study · v0.1
Pandam Wildlife Park: what the satellites say before anyone goes there
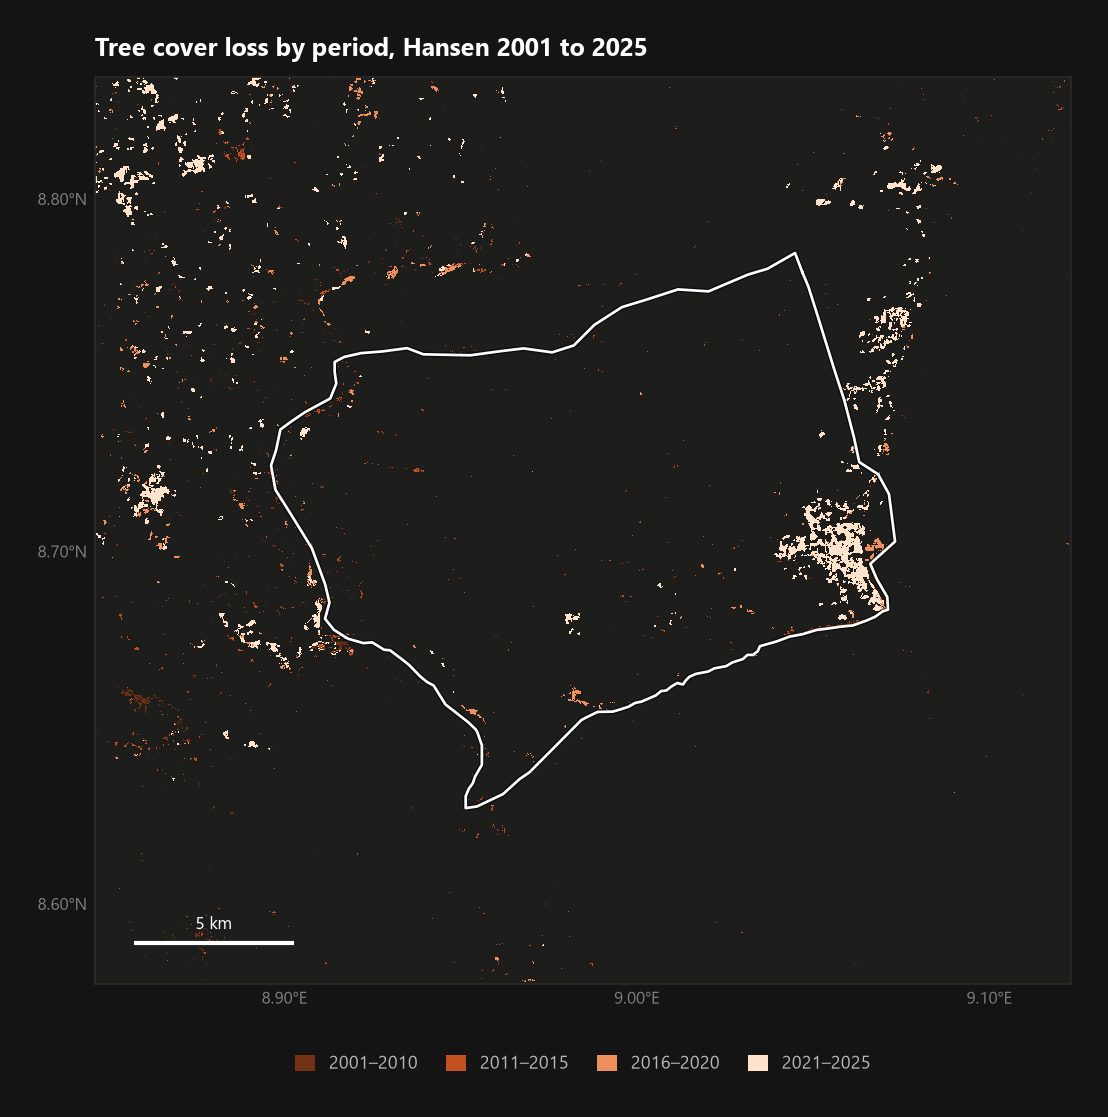
Pandam is intact woodland in a farmed landscape, and it shows. It holds nearly three times the biomass per hectare of the land around it. It is also not a carbon site: the trees are small and the tonnage is low. Its one sharp finding is new: about 321 ha of woodland was removed in the south-east corner in 2024 and 2025, more than in the previous 23 years combined.
This is a desk study. Nobody from Kam Edge has been to the park for it. It uses only free satellite products and a public boundary file, and took no approvals. Section 7 says what a field pilot would add.
Claims are tagged. Measured is read directly from a public dataset. Derived is arithmetic on those readings. Assumption is our judgement.
1The reserve
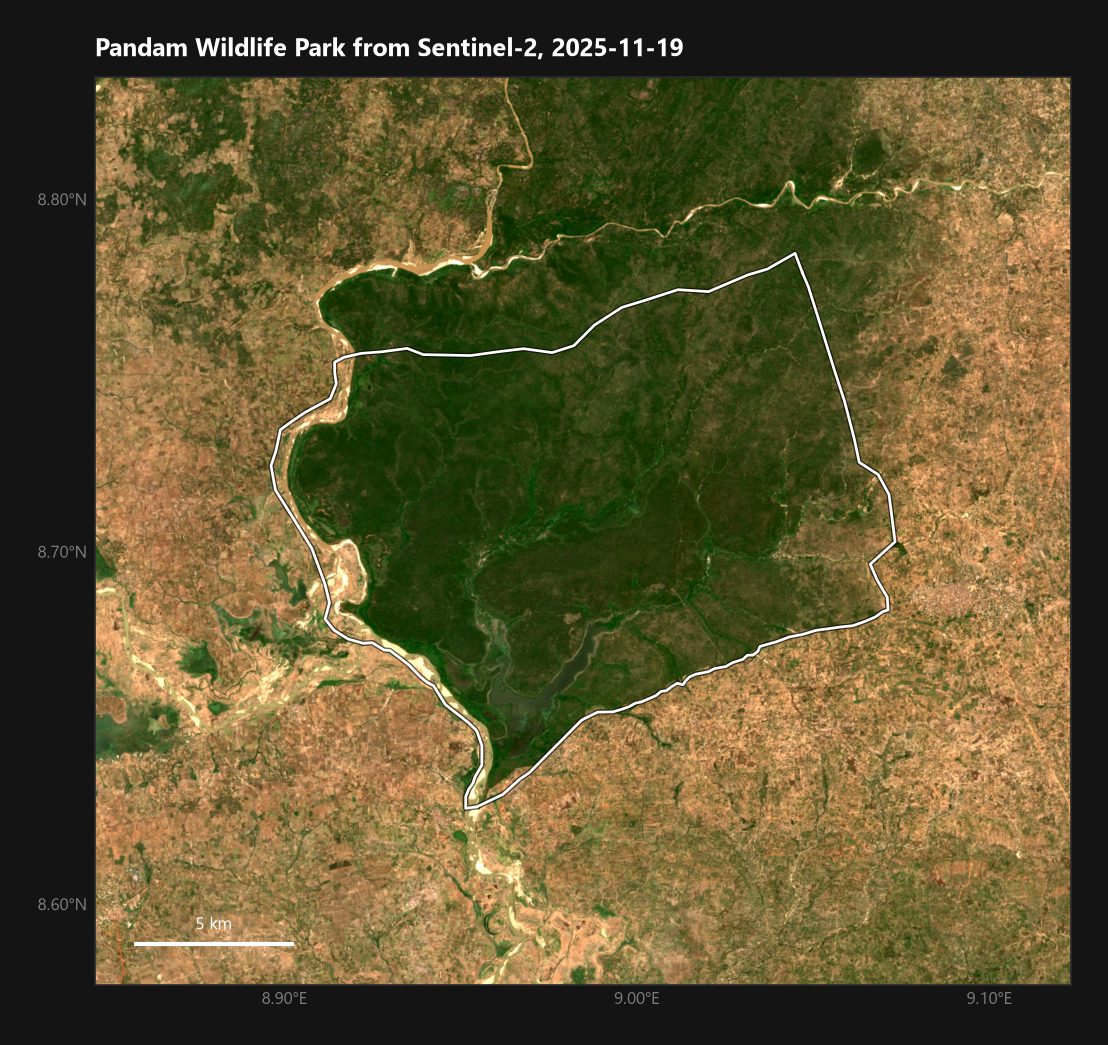
- Boundary used. No polygon for the wildlife park itself exists in the World Database on Protected Areas or OpenStreetMap. This is the Ramsar site polygon 'Pandam and Wase Lakes' (site 903111), which is smaller than the 22,400 ha reported for the park. Measured
- Area. 19,759 ha by this polygon, against 22,400 ha reported for the park: about 2,641 ha short.
- The image suggests where the missing area is. In the Sentinel-2 picture below, the same dark woodland continues north of the line to the river. The park very likely extends to the river. Assumption
- A conflict in the public record. The database lists the managing authority as the Nasarawa State Ministry of Agriculture. Pandam is in Plateau State. This needs checking with the Plateau State government.
- Location. Centred near 8.712°N 8.987°E.
2Forest history
- The standard forest products barely see Pandam. Mean canopy cover in 2000 was 12.6%. At the usual 30% threshold only 33 ha counts as tree cover. The JRC moist-forest record does not apply: 99% of the park is outside its definition. Measured
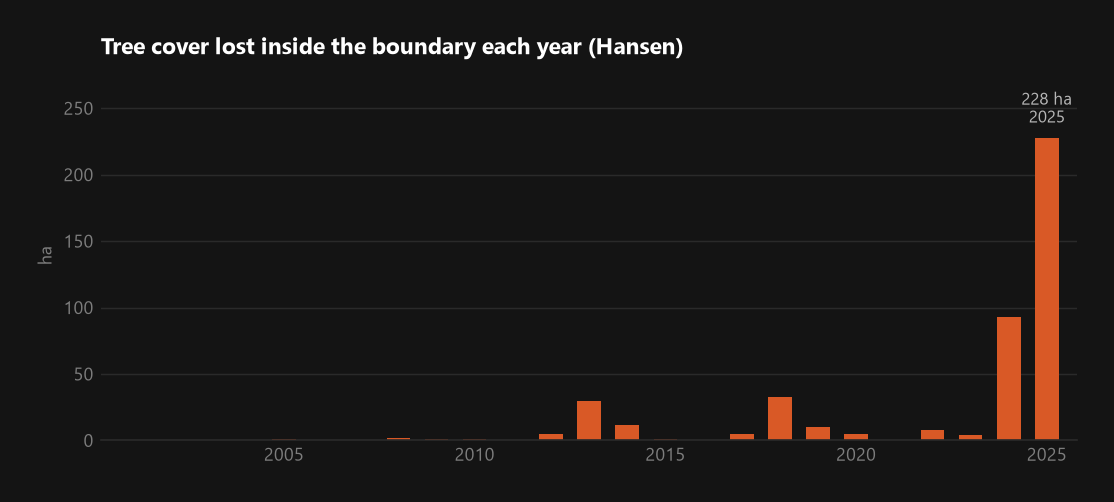
- Counting every loss pixel, 440 ha was lost from 2001 to 2025, 2.2% of the polygon.
- 73% of that happened in the last two years: 93 ha in 2024 and 228 ha in 2025. The latest year is provisional.
- For 23 years almost nothing happened. The largest earlier year was 33 ha.
On the pixels flagged as lost in 2024 and 2025, NDVI in November 2025 was 0.46, against 0.65 for the woodland around them. Something removed the canopy and it had not recovered. One image cannot say whether it was felling, farming or a hot fire. Someone needs to go and look.
3Present condition
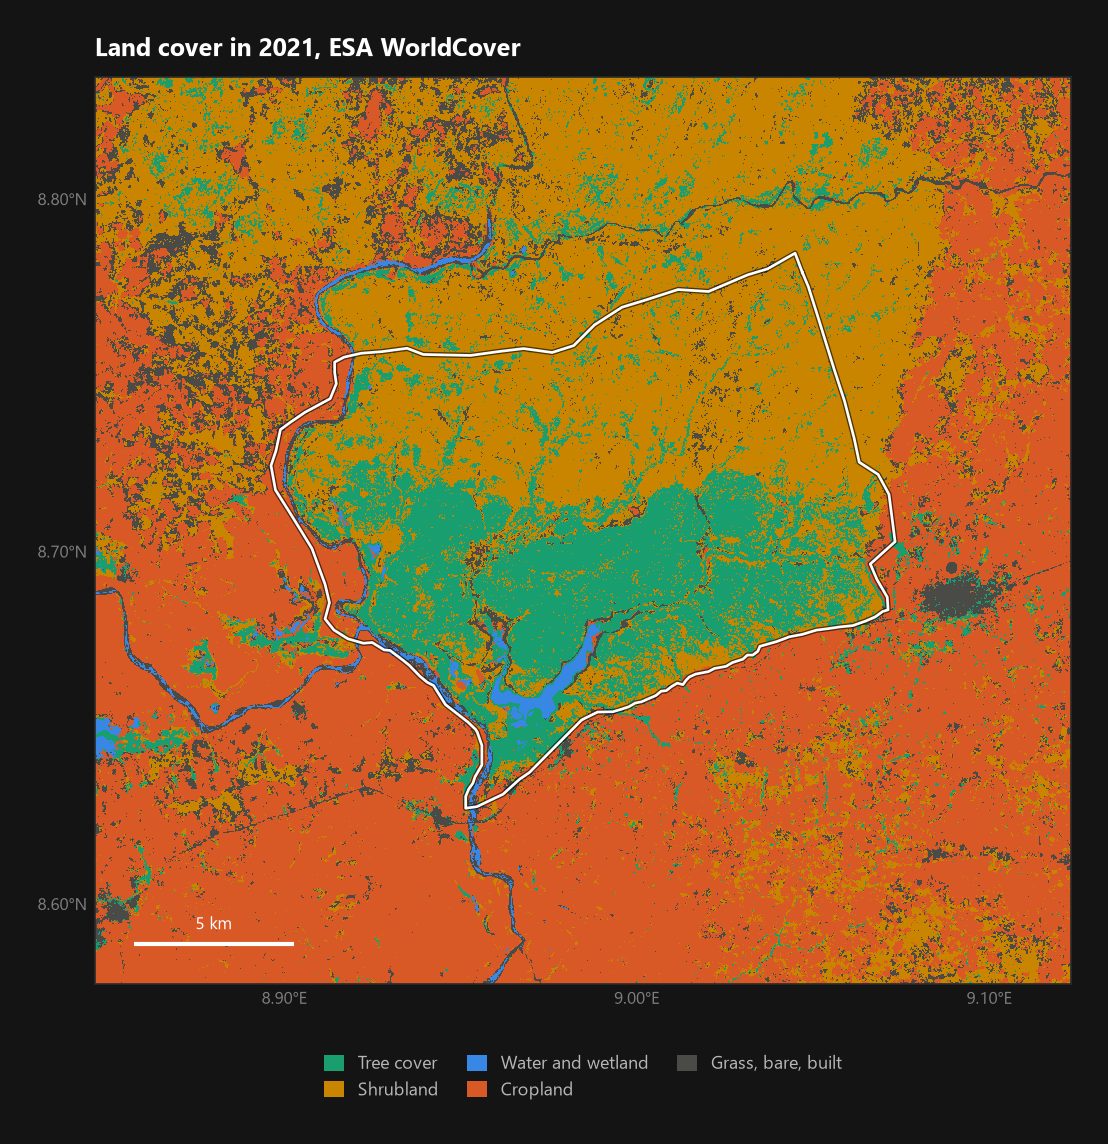
| Land cover, 2021 | Hectares | Share |
|---|---|---|
| Tree cover | 7,719 | 39.1 |
| Shrubland | 10,078 | 51.0 |
| Grassland | 764 | 3.9 |
| Cropland | 795 | 4.0 |
| Bare or sparse | 30 | 0.2 |
| Water | 257 | 1.3 |
| Herbaceous wetland | 108 | 0.5 |
- 90% of the polygon is woodland or shrubland. Cropland inside is 4.0%. Measured
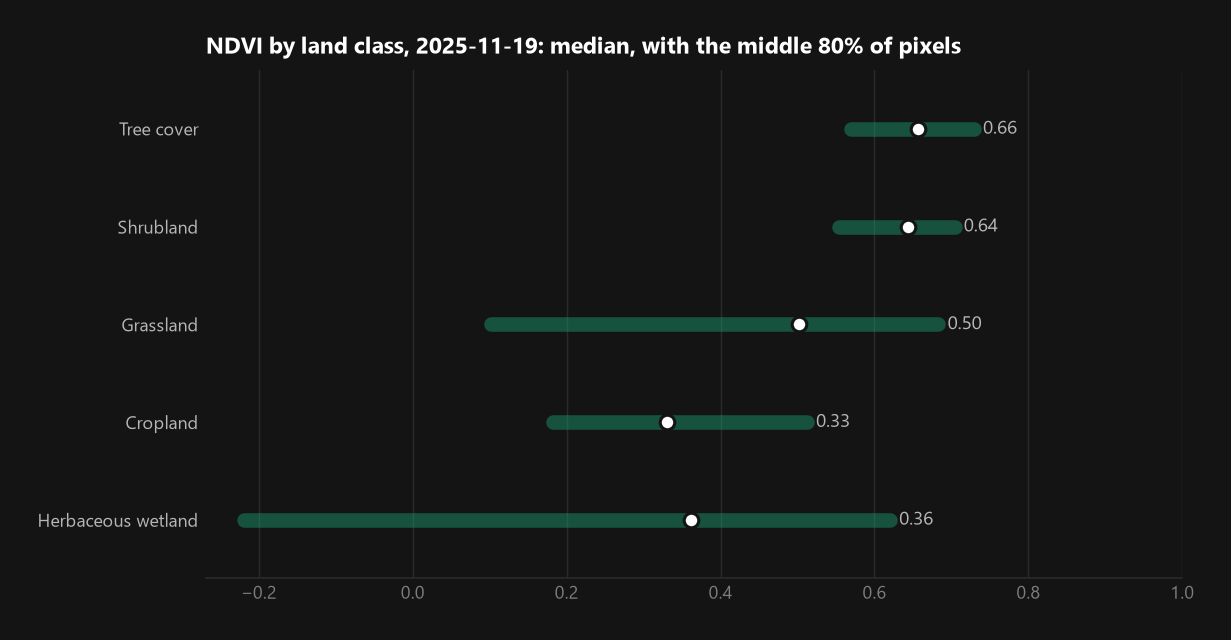
- NDVI works here. Woodland reads 0.66, cropland 0.33. Unlike closed rainforest, open savanna woodland does not saturate the index, so a multispectral drone is a useful tool at Pandam.
- Cloud is not a problem. 56 Sentinel-2 scenes in the past year were under 40% cloud (two tiles overlap here), against 14 at Omo.
- The canopy-height model says 13.1 m on average. These models overestimate open woodland; treat it as an upper figure.
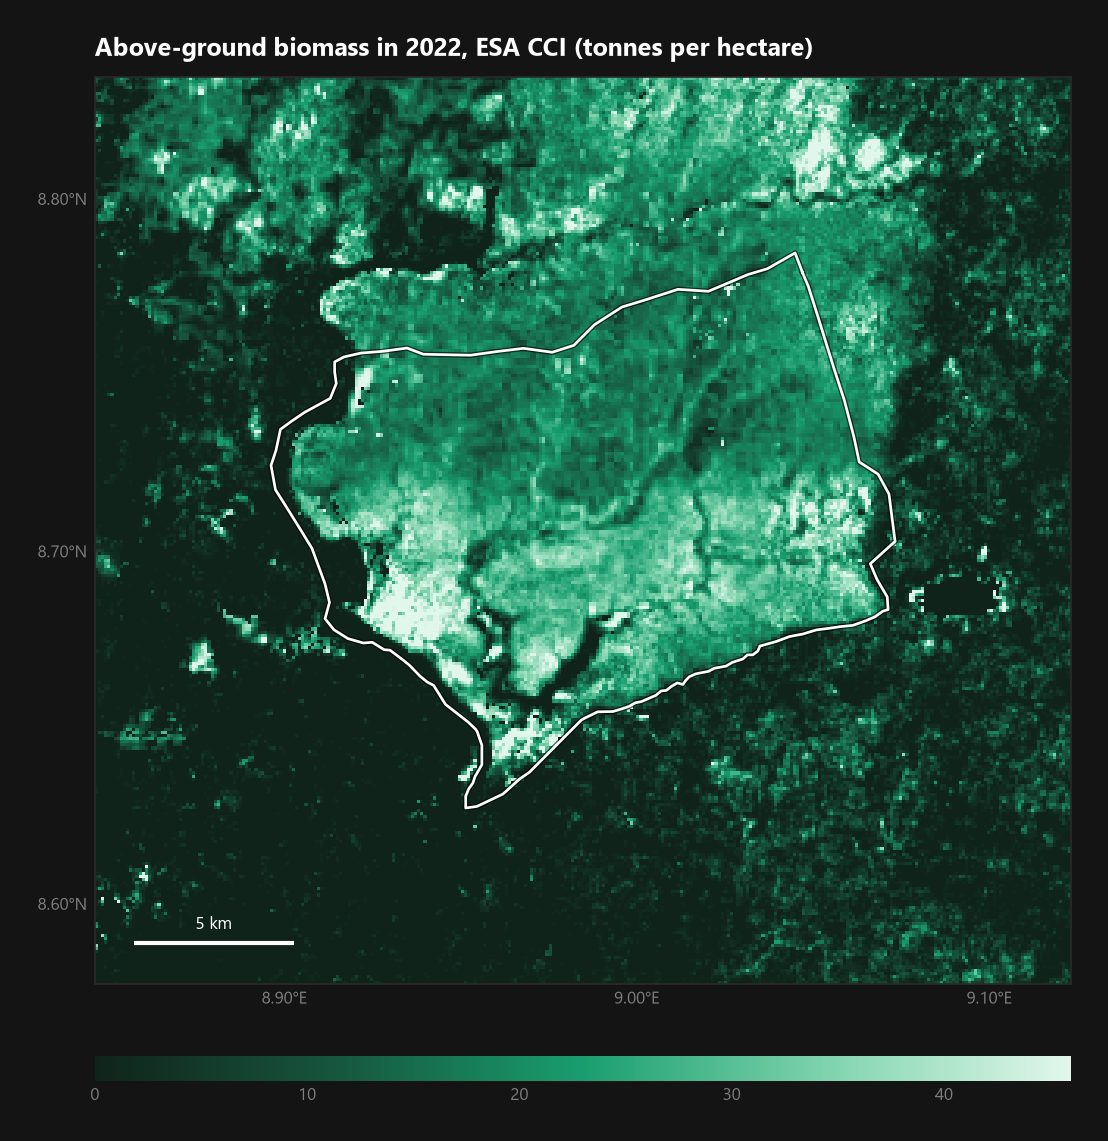
4First carbon estimate
| Class | Biomass, t per ha | CO2e, t per ha | Map error, t per ha |
|---|---|---|---|
| Tree cover | 32.2 | 55 | 19.0 |
| Shrubland | 17.6 | 30 | 10.6 |
| Grassland | 3.1 | 5 | 1.9 |
| Cropland | 0.9 | 2 | 0.6 |
| Herbaceous wetland | 16.6 | 29 | 10.5 |
- Whole polygon: 430,000 tonnes of above-ground biomass, or 0.7 million tonnes of CO2e. Derived
- Per hectare: 21.6 t inside against 7.9 t in the surrounding 5.5 km. The park holds 2.7 times as much.
- Uncertainty: about ±60% on the cautious reading. Roots and soil are not counted, and in savanna they matter more than in rainforest.
5Pressure map
- The recent loss is at the edge. 79.5% of 2021 to 2025 loss is within 2 km of the boundary, which holds 51.4% of the area. Derived
- It is one place. Almost all of it sits in the south-east corner, around 8.70°N 9.05°E, in a block roughly 3 km across.
- The farmland outside is closing in from the east and west, with scattered recent loss right up to the line.
6Revenue readiness
| Stream | Reading for Pandam |
|---|---|
| Avoided deforestation | Too small to build on. If the 2024–2025 rate of 160 ha a year continued and were stopped, at 30 to 55 t CO2e per hectare the gross saving is 4,815 to 8,828 t a year. After deductions that is about 1,444 to 4,325 credits, or $7,222 to $43,255 a year. Derived |
| Restoration | Limited. The polygon is already 90% woodland and shrubland. |
| Wetland and biodiversity | The real asset. It is a listed wetland of international importance. There is no cash market for that today. |
| Water, tourism | Not assessable from this data. |
Pandam's value is its wetland and its wildlife, not its carbon. It is well suited to satellite monitoring: small, rarely under cloud and sharply bounded, so change inside it shows up quickly.
7What a field pilot would add
- The gazetted boundary, from Plateau State, and an answer on who manages the park.
- A visit to the south-east corner to establish what happened in 2024 and 2025.
- A drone survey of that corner. The affected block is roughly 3 km by 3 km, a few flights, and multispectral imagery is informative here.
- Twenty to thirty ground plots in woodland and shrubland, including root and soil sampling if carbon is to be claimed at all.
- Bird and mammal recorders around the lake, which is where the park's listed value lies.
- Monthly satellite checks. With this little cloud, optical imagery alone would have caught the 2024 clearing within weeks.
8Sources and limits
| Layer | Source | Resolution and date | Limit |
|---|---|---|---|
| Boundary | World Database on Protected Areas, UNEP-WCMC | Site 903111 | Polygon as published; not checked against a gazette |
| Tree cover loss | Hansen Global Forest Change v1.13 | 30 m, 2001 to 2025 | Loss of tree cover, not of forest; includes plantation harvest and fire |
| Forest condition | JRC Tropical Moist Forest | 30 m, 1990 to 2025 | Moist forest only; recent clearing is confirmed late |
| Land cover | ESA WorldCover v200 | 10 m, 2021 | One year; tree crops count as tree cover |
| Canopy height | ETH Global Canopy Height | 10 m, 2020 | A model trained on space lidar; overestimates open woodland |
| Biomass | ESA CCI Biomass v6 | 100 m, 2022 | Radar-based; known to read low in dense forest |
| Recent image | Sentinel-2 L2A | 20 m, 2025-11-19 | Scene S2C_32PMQ_20251119_0_L2A + S2C_32PNQ_20251119_0_L2A |
- All figures are for the wetland-site polygon. If the park is larger, totals rise; per-hectare figures should hold.
- Areas are computed per pixel from latitude. Tree cover loss counts every loss pixel inside the polygon, with no canopy threshold.
- Biomass by class uses only 100 m pixels at least 80% covered by one class. Carbon is 47% of biomass.
- The revenue line uses 30–40% deductions, 50–70% effectiveness and $5–10 a credit.
- Nothing here has been checked on the ground or against state records.