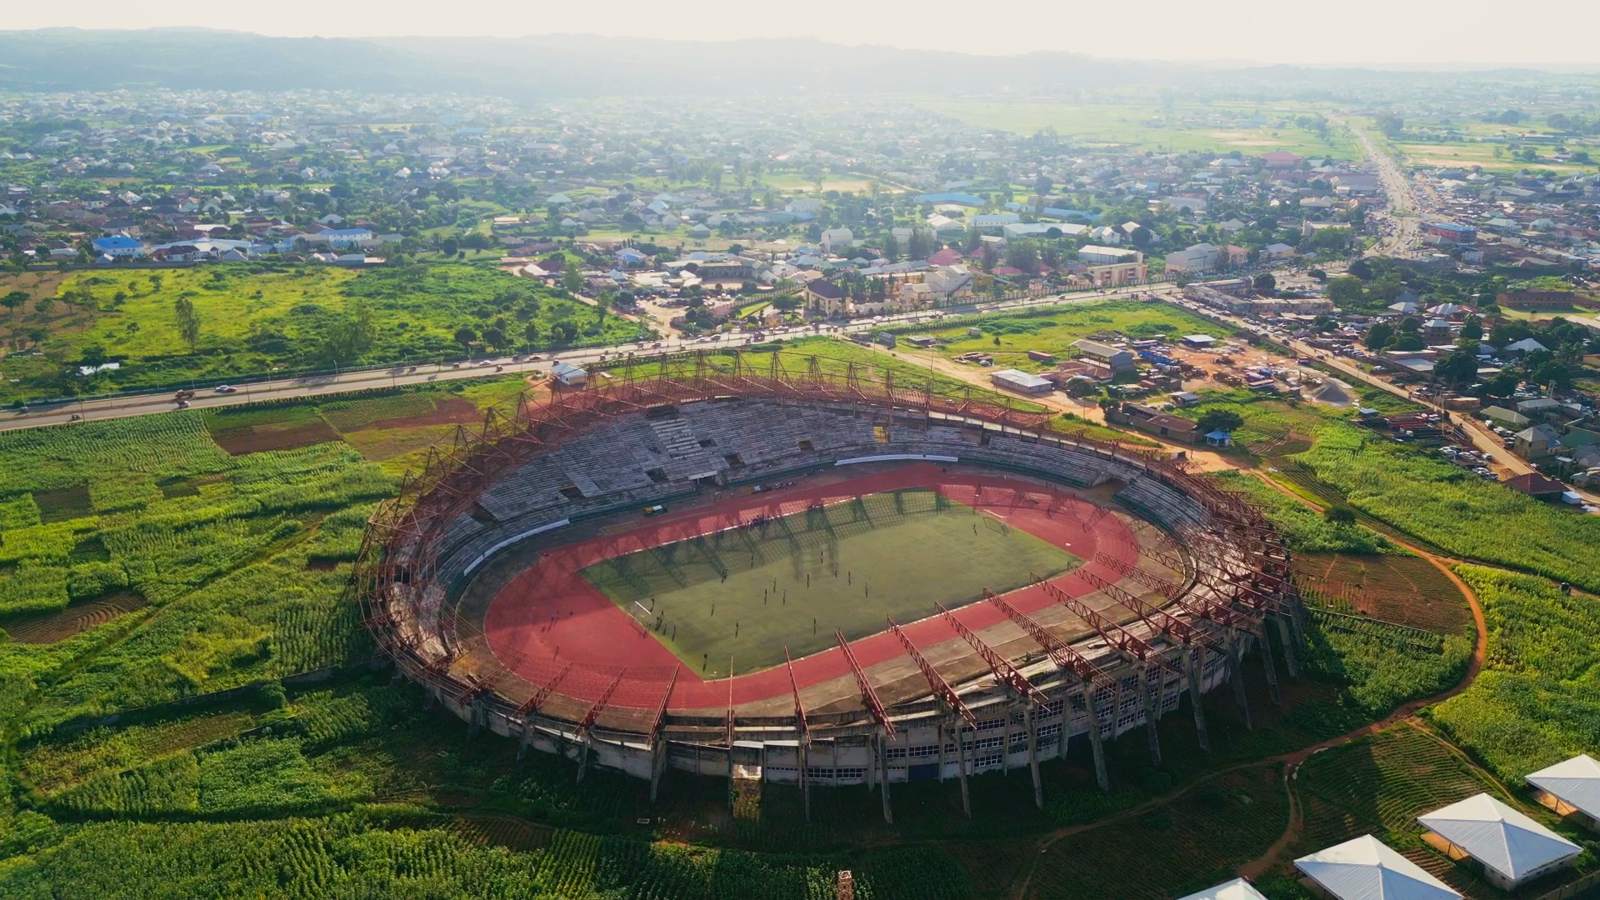
Plateau United's home ground in Jos from the air: the oval bowl with its red running track and green pitch, ringed by farmland with the city beyond
Deployment Proposal — Confidential

Every match you play,
on the numbers.

A proposal to deploy PitchTrack at Plateau United for the coming NPFL season: a three-lens fixed camera rig on your touchline, a match report in the coach's hands the next morning, and per-player physical output across the whole campaign — run end to end by us, as a managed service.

Prepared by Kam Labs For Plateau United FC Following the August 2026 pilot Version 1.1 — 6 September 2026
Plateau United  ·  home ground, Jos  ·  from the air
01 / 10

Where this starts

You have already seen the rig work.

Plateau United came onto the PitchTrack pilot on 30 August 2026, alongside four academies. This proposal is not asking you to believe a specification — it is asking you to extend something that has already been stood up on a Nigerian pitch, in Nigerian daylight, on Nigerian power.

2 × 96 min Full matches captured end to end, three lenses each, not a clip
16.0–16.7 fps Sustained 4K capture per lens across a whole match — re-cabled to 19.6 fps on a 45-minute soak
3 / 3 Lenses still recording at the final whistle. No dropped camera
99,725 Measured player positions behind a single published team report
The report on the next slide is real and it is public. It was generated from a match we captured ourselves — Ajester FA v Gimbiya FA — and it is the same document a Plateau United fixture produces. We are showing you somebody else's match because we have not yet published one of yours, and inventing a mock-up of your own squad would tell you nothing about what the system can actually measure.
02 / 10

Deliverable 01 — the match report

What lands in the coach's inbox the next morning.

One page per match, written to be read by a coach rather than an analyst. It answers the questions a manager actually asks after a game — who had the ball, where the game was played, how hard each side worked, and where the shape broke — and it withholds any figure it could not measure rather than estimating one.

Who had it

Possession across the match and in rolling windows, carrying a confidence interval rather than a decimal that implies precision nobody has. In the published report the two sides finished level — 50.1%, interval 47.8–52.4.

Where it was played

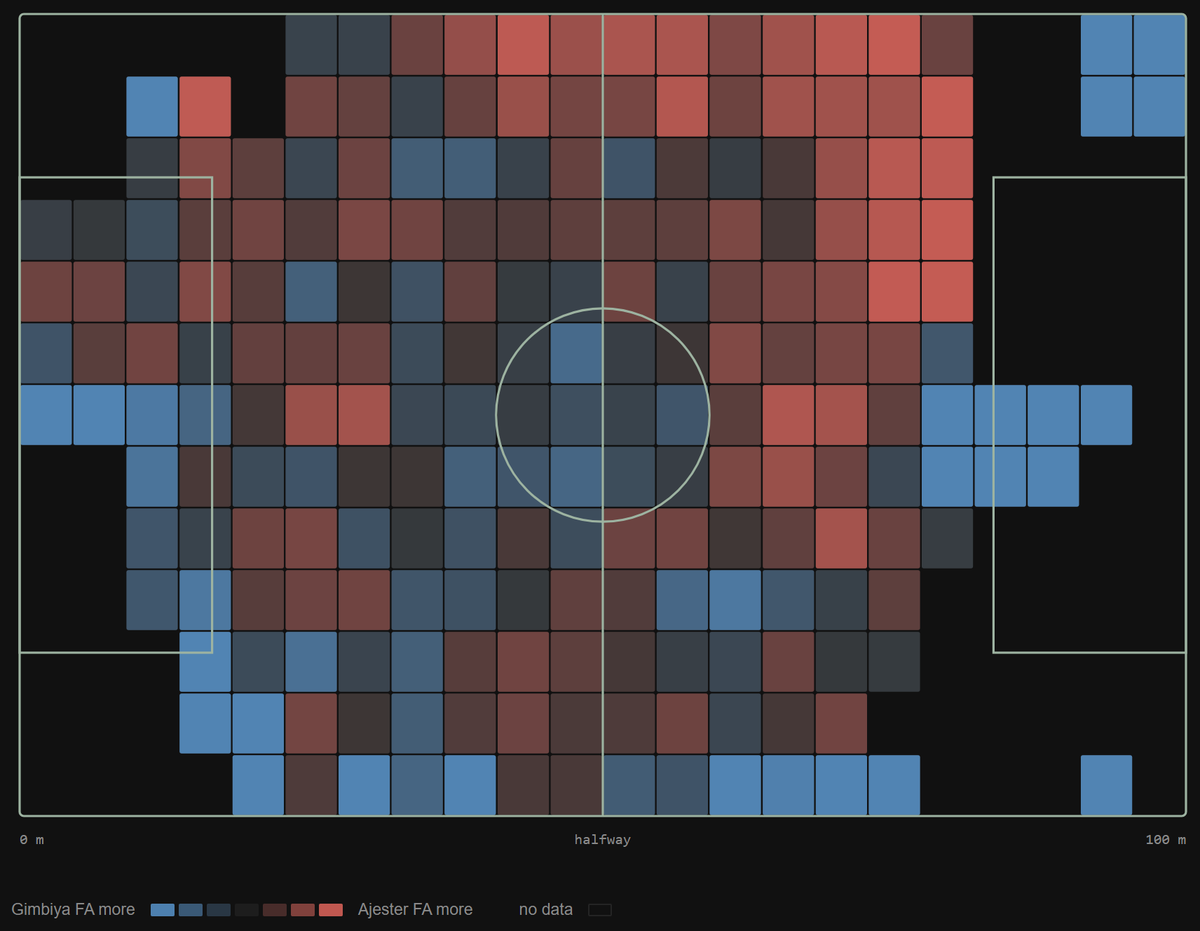
Territory per side in metres, the centroid each team defended around, and the zone-control map below. Not a heat map of one team — a comparison of both, square by square.

Shape, and the work

Where each side sat across the width and the length, how the block shifted between halves, and how hard each side worked to hold it — distance, high-intensity share, top speeds.

Zone-control map: a grid over the pitch shaded towards whichever side occupied each square more
From the published report

Zone control — one square per patch of pitch, shaded towards whichever side occupied it more. Not a heat map of one team; a comparison of both.

Read straight off it: the red side owned the middle third and the far flank, while the blue side held both touchlines and the corners. Squares with too little data to call are left unshaded rather than filled in.

03 / 10

The hardware

One mast. Three lenses. Nobody filming.

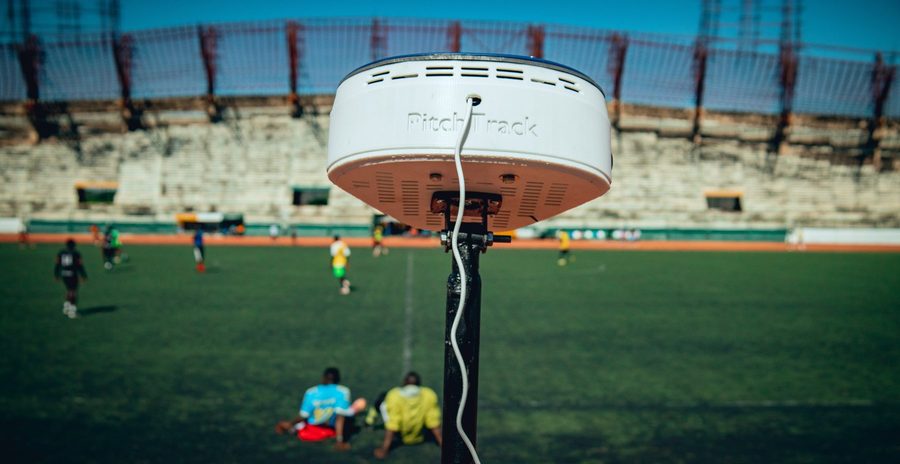
A sealed head on a mast behind the touchline, recording all three lenses to a card on board. No camera operator, no tracking shot, no laptop at the pitch. It is switched on before the warm-up and collected after the whistle; everything else happens back at base.

The PitchTrack hub — a sealed white head housing the cameras and the recorder
The headSealed, passively cooled, weather-tolerant. Cameras, recorder and storage in one unit.
Close-up of one of the three camera lenses in the hub
Three lensesOne centre, two angled out to the goals. Together they cover the pitch end to end.
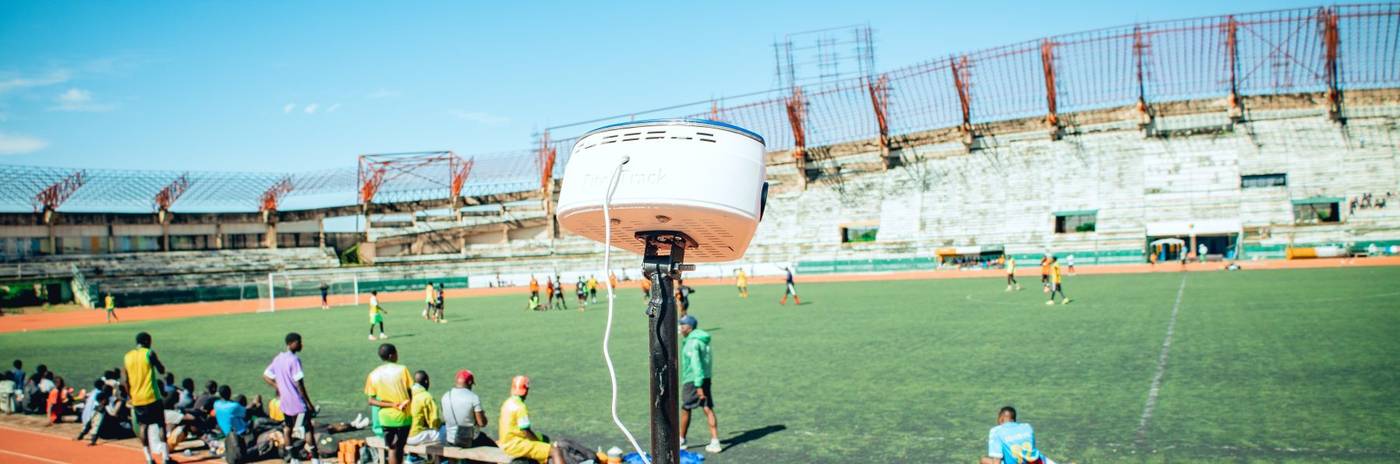
The rig mounted on its mast beside the pitch during a match
On the touchlineSet back from the line on its own mast. Ten minutes to raise, aim and start.
Power

Runs off a small generator or a battery pack over a 1.5 mm² supply run. It does not need mains at the pitch.

Network

None required on match day. Footage is written to the card on board and carried back; nothing is uploaded from the ground.

Storage

A full match is about 63 GB across three lenses. Cards are sized with headroom and swapped between fixtures.

Crew

Two of ours on match day — one to set up and aim, one to run the capture. Your staff do nothing.

04 / 10

Deliverable 02 — per-player analytics

Your eleven, named once, tracked for ninety minutes.

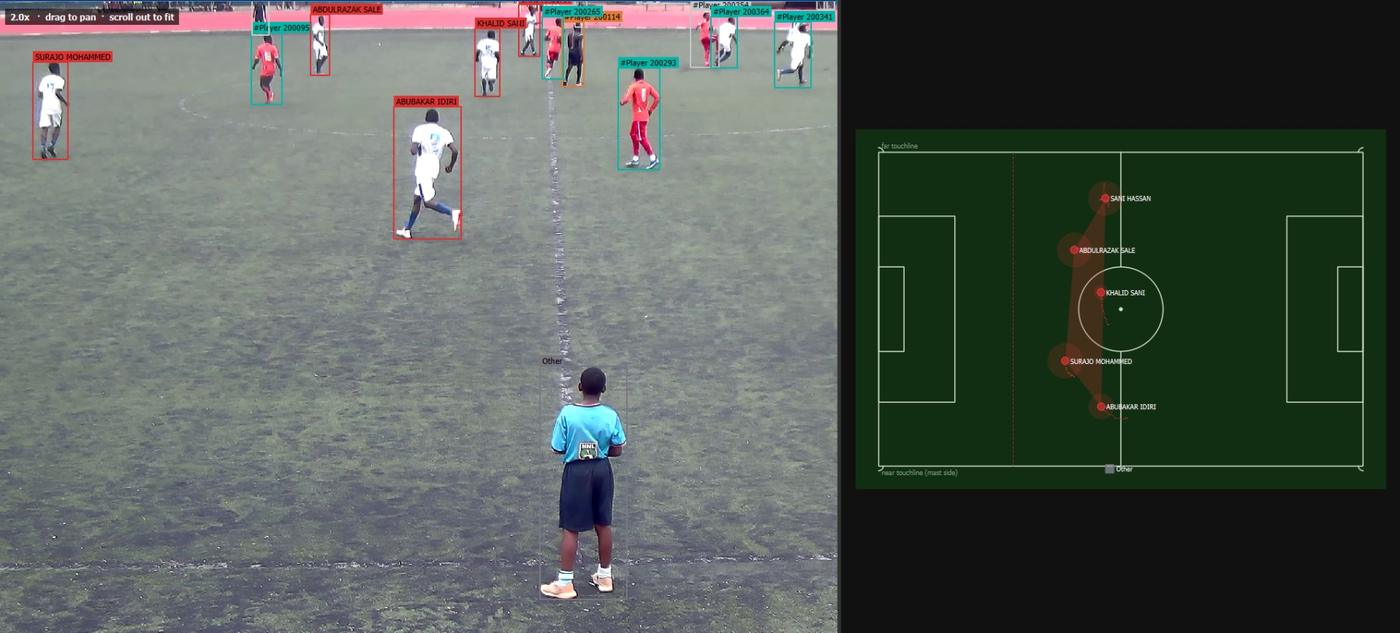
The team report needs no identities. Player numbers do — and identity is the hard part of tracking football from a fixed camera, because a player who walks behind another comes back out as a stranger. Our answer is to stop naming tracks and start naming shirts: an operator names your eleven once, and the software keeps each shirt pointed at whoever is currently carrying it.

PitchTrack on real match footage: the left panel shows every player boxed and followed, four of them named and the rest still labelled #Player; the right panel is a top-down pitch showing those named players with the ground each has covered shaded around them
The naming pass, mid-match

Left, every body found and followed — four already named, the rest still waiting for one, and anyone on the grass who is not playing marked as such and left out of the numbers. Right, the same players top-down on the pitch in metres, with the ground each has covered drawn around them. Corrections the operator makes carry forward and back through the match.

Per player, per match
  • Minutes played, split by half
  • Distance covered, in metres
  • Metres per minute — work rate, not raw distance
  • Top speed and sprint count
  • Heat map and average position
Across the season
  • Squad load board — who is being run into the ground
  • Per-player trend across fixtures
  • Development view for the academy graduates
How it is delivered

A hosted club dashboard, one login per member of staff, with a lite view for the head coach and an analytical view for the fitness staff. The same numbers, two depths.

The honest part

This step has a human in it, and will for this season. Slide 07 is the full account of what that means and where it is still weak.

05 / 10

What it is worth to the club

Five arguments, and none of them is “data is good”.

A camera on the touchline is a cost. These are the specific places it pays for itself at an NPFL club, in the order we think they matter for Plateau United.

01 · Selling players

“He's quick” is not a negotiating position

A buying club abroad asks for numbers, and a Nigerian club that cannot produce them negotiates from anecdote. A season of match-by-match distance, work rate and top speed — measured, not claimed — changes what a player is worth and how quickly the conversation gets serious.

02 · Load and injury

Knowing who has been run into the ground

Minutes on a team sheet do not tell you who worked. The squad load board shows metres per minute across the last five fixtures, so a rotation decision is made against what the players actually did rather than against how tired they look on Thursday.

03 · Opposition

Where the next side actually plays

Every match we capture builds a territory and zone-control profile. Captured across a season, that is a file on how each opponent sets up, which flank they load, and how far their block sits from their own goal.

04 · The academy

A record that follows the player up

Academy graduates arrive with a reputation and no history. The same rig at academy fixtures produces a physical record from the age they start being measured, which is the difference between promoting on a hunch and promoting on a trend.

05 · Sponsors and media

Something to publish between fixtures

The published match report is a public artefact with the club's name on it. It gives the media team something factual to post midweek, and gives a sponsor a page that is not a photograph of a scoreline.

And what it is not

This is not a tactical AI and does not tell a coach what to do. It measures what happened. Every conclusion in the report is one a coach could have reached by watching the match four times — the value is that they did not have to.
06 / 10

What we cannot do yet

The part most proposals leave out.

You are being asked to pay for a system that is measured rather than finished. Here is exactly where the line sits, taken from our own engineering record rather than softened for this document. Everything in the first column is delivered on day one; the rest is where the work still is.

Measured automatically

No human in the loop. This is what a match produces on its own:

  • Territory, shape and zone control per side
  • Possession, with a confidence interval
  • Pressing intensity and work rate per side
  • Every body on the pitch, placed in metres
Needs an operator

Reliable, and it costs analyst hours. Priced in on slide 09:

  • Per-player distance, minutes and speed
  • Naming your eleven and correcting the binder

Automatic identity is not solved. Left alone, a tracked identity survives about 15–20 seconds before a player walking behind another breaks it. Naming shirts instead of tracks cut the operator's workload by 17× and eliminated cross-team mix-ups, but a person still supervises it.

Not there yet
  • Live analytics. Processing a match takes roughly eight hours, so reports are next-morning, not half-time.
  • Passes, shots and events. The rig does not track the ball; possession comes from a second camera and produces no distances.
  • Full pitch coverage. On the current 3.8 m mast the three lenses leave about 7.6% of the pitch uncovered. Raising to 5 m closes it, and is in the deployment plan.
Why we are telling you this. Every one of these is a number we measured and published against ourselves, and each has a dated engineering record behind it. A supplier who cannot tell you where their system fails has not looked. We would rather you sign knowing the shape of the first season than discover it in October.
07 / 10

How it runs

Four weeks to ready, then every fixture.

A managed service: we own the rig, we travel with it, we run the capture and we produce the report. What we need from Plateau United is access and a squad list, not staff and not equipment.

Weeks 1–2

Ground survey and mast install

We survey the Jos stadium, fix the mast position and raise it to 5 m, and calibrate the three lenses against the real pitch markings. Calibration is done once per ground and is what makes every later figure a measurement in metres rather than a count of pixels.

Week 3

Squad onboarding

Your squad goes onto the player register — names, shirt numbers, positions — so that every match report attributes to a person rather than to a shirt. This is also what carries a player's record with them if they leave.

Week 4

Dry run on a friendly or a training match

A full capture and a full report on a fixture that does not count, so the first league match is not also the first time the chain runs end to end at your ground.

Match days

Capture, process, deliver

Crew on site two hours before kick-off. Capture through to the final whistle. Processing and the naming pass overnight. Team report and player numbers in the dashboard within 24 hours, and a written summary within 72.

From us

What Plateau United needs to provide

Stadium access on match days and for the survey; permission to leave a mast in place; a squad list with shirt numbers; and one point of contact on the technical staff who receives the reports. No equipment, no operators, no IT.

08 / 10

Pricing

A season fee, and where every naira of it goes.

Priced as a managed service across a season rather than as hardware you buy, because the rig needs calibration and the naming pass needs a trained operator — and both of those should be our problem, not yours. Figures are indicative and become firm on the scoping items at the foot of this slide.

Option A

Home programme

₦11.4m19 home league fixtures · ≈ ₦600,000 per match
  • Team report within 24 hours of every home fixture
  • Territory, zone control, possession, work rate
  • Season dashboard, one login per staff member
  • No away fixtures, no per-player numbers
Option B — Recommended

Full season

₦21.6m38 fixtures, home and away · ≈ ₦568,000 per match
  • Everything in Option A, home and away
  • Per-player minutes, distance, work rate, top speed
  • Squad load board and per-player season trend
  • Opposition profile built across the season
  • Squad onboarded to the player register
Option C

Extended pilot

₦5.2m8 fixtures · ≈ ₦650,000 per match
  • Everything in Option B, over eight fixtures
  • No season commitment
  • Fee credited in full against A or B if you upgrade before the eighth match
Option B — where the money goes
Match dayCrew, travel, capture and on-site operation, 38 fixtures
₦9,100,00042.1%
AnalysisProcessing, the naming pass, report writing
₦6,000,00027.8%
EquipmentRig, mast and spares, amortised across three seasons
₦2,600,00012.0%
PlatformCompute, storage and the hosted club dashboard
₦1,900,0008.8%
SupportAccount management, staff training, contingency
₦2,000,0009.3%
The five lines add to the total exactly; shares are derived from them and rounded to one decimal ₦21,600,000≈ US$13,500 · full season, home and away, end to end
Assumes a 20-club NPFL season (19 home fixtures, 38 in all), all home matches at one ground in Jos with the mast left standing, away capture by road, and ₦1,600 to the dollar on the imported hardware line. A ground that will not take a mast, or a second rig for academy fixtures on the same weekend, both move the match-day line materially — we would rather re-price against your fixture list than defend a number built from assumptions.
09 / 10

Next step

Three things, and the first one is free.

The pilot rig is already built and the crew is already trained. Nothing here needs a long procurement.

01 · This month

A ground survey at Jos

Half a day, no cost, no commitment. We measure the ground, confirm where a 5 m mast can stand, and tell you honestly whether the stadium geometry gives full pitch coverage. If it does not, you find out before you have paid anything.

02 · Fixture list

Re-price against the real calendar

Send us the confirmed fixture list and we replace every assumption on slide 09 with the actual number of home matches, the actual away travel, and the actual dates. The price moves to firm.

03 · One match

Capture a fixture and see the report

Pick any home fixture. We capture it, process it, and put the full report and the player numbers in front of your technical staff before you sign anything longer.

One page you should read before deciding. The published match report at kamhq.com/sports/report is the real output of a real capture, including the places where it says a figure could not be measured. It is the most honest description of this product that exists, and it is the one we would most like you to judge us on.
10 / 10